June 22, 2025 a 09:03 amIEX: Trend and Support & Resistance Analysis - IDEX Corporation

The IDEX Corporation stock (IEX) has recently experienced notable fluctuations in the market. Within the industry segments of Fluid & Metering Technologies, Health & Science Technologies, and Fire & Safety/Diversified Products, IEX continues to be a significant player with diverse applications. With recent trends indicating moderate positive shifts, investors observe IEX with cautious optimism, amidst an overarching backdrop of both opportunities and challenges within its market space. Attention to forthcoming data releases and market conditions will be crucial for potential investors.
Trend Analysis
Analyzing the IEX stock data reveals a variation in stock performance driven by several factors in recent months. Through the calculation of the EMA (Exponential Moving Average) over the 20 and 50-day periods, the trend direction becomes apparent.
| Date | Closing Price | Trend |
|---|---|---|
| 2025-06-20 | 173.15 | ▼ |
| 2025-06-18 | 175.03 | ▼ |
| 2025-06-17 | 175.99 | ⚖️ |
| 2025-06-16 | 179.92 | ▲ |
| 2025-06-13 | 177.82 | ⚖️ |
| 2025-06-12 | 182.51 | ▲ |
| 2025-06-11 | 183.17 | ▲ |
The EMA calculations indicate a recent shift towards an upward trend as demonstrated by periods where EMA20 surpasses EMA50, although the trend frequently oscillates, reflecting market volatility. This scenario underscores cautious optimism, favoring small strategic entries.
Support and Resistance
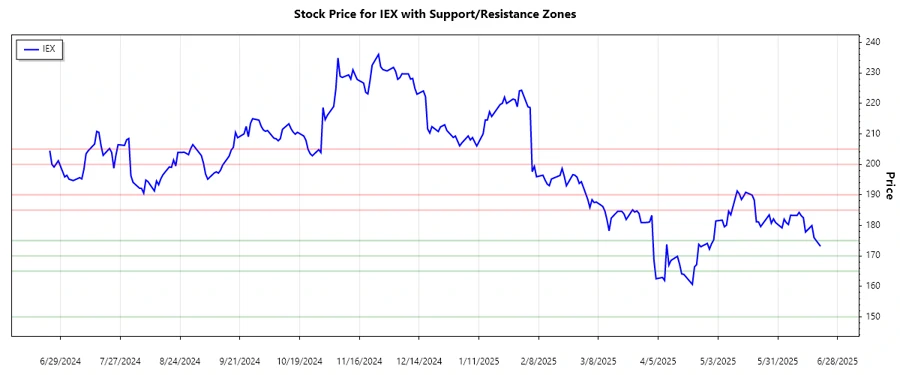
The support and resistance levels provide a crucial framework for understanding the potential price ceilings and floors. Analyzing historical price data enables the identification of these strategic zones.
| Zone Type | From | To |
|---|---|---|
| Support | 170.00 | 175.00 |
| Support | 150.00 | 165.00 |
| Resistance | 185.00 | 190.00 |
| Resistance | 200.00 | 205.00 |
The closing price is currently approaching a resistance zone near 185.00, suggesting potential retests or breakthroughs that will inform subsequent movements. Traders will need to discern the likelihood of a breakout or rejection based on forthcoming data releases and market sentiment.
Conclusion
In analyzing the IDEX Corporation’s stock trends, a recent penchant for upward momentum is detectable, albeit intermittent. The market showcases support levels below current prices, providing potential safety nets for bullish investors. Simultaneously, the resistance levels delineate potential price caps, cautioning against exuberant bids without thorough due diligence. Balancing these insights, investors should approach with adaptive strategies, responsive to market indications and broader economic indicators.
Smart Data Insight
Master the Perfect Entry & Exit for this Stock
Don't leave your profits to chance. Historically, this stock follows specific seasonal patterns that institutional traders use to maximize returns.
- ✅ Identify the "Golden Buying Window"
- ✅ Avoid high-risk correction cycles
- ✅ Backtested data from the last 20+ years