May 01, 2026 a 02:46 am

IEX: Dividend Analysis - IDEX Corporation
IDEX Corporation presents a robust dividend profile with a consistent track record of 32 years of dividend payments. The company offers a modest dividend yield with steady growth over recent years. Despite a low yield, the considerable years of uninterrupted dividend payments highlight the company's commitment to returning value to shareholders. The payout ratios are conservative, ensuring ample coverage and potential for future growth.
📊 Overview
The dividend overview provides insight into IDEX Corporation's dividend strategy and sustainability. The data below encapsulates key dividend metrics, emphasizing the sector's influence and highlighting the length of the dividend history.
| Metric | Details |
|---|---|
| Sector | Industrial Machinery |
| Dividend yield | 1.44% |
| Current dividend per share | 2.82 USD |
| Dividend history | 32 years |
| Last cut or suspension | None |
🗣️ Dividend History
Examining the dividend history gives insight into IDEX Corporation's pattern of returning value to shareholders. With 32 years of consistent dividends, the company demonstrates stability and reliability in its payouts.
| Year | Dividend per share (USD) |
|---|---|
| 2026 | 0.71 |
| 2025 | 2.82 |
| 2024 | 2.71 |
| 2023 | 2.52 |
| 2022 | 2.34 |
📈 Dividend Growth
The growth rate of dividends over time is a crucial indicator of a company's capacity to increase shareholder value. IDEX Corporation has shown promising growth in dividends, with a steady rate over the past few years.
| Time | Growth |
|---|---|
| 3 years | 6.42% |
| 5 years | 7.11% |
The average dividend growth is 7.11% over 5 years. This shows moderate but steady dividend growth.
✅ Payout Ratio
The payout ratio measures the portion of earnings and free cash flow paid to shareholders in the form of dividends. A low ratio suggests there is room to maintain or grow dividends over time.
| Key figure | Ratio |
|---|---|
| EPS-based | 41.32% |
| Free cash flow-based | 34.33% |
IDEX Corporation's payout ratios indicate a healthy balance between rewarding shareholders and retaining earnings to fuel future growth.
⚠️ Cashflow & Capital Efficiency
Examining cashflow metrics reveals the company's ability to cover dividends and efficiently allocate capital. Healthy cashflow and capital efficiency metrics underpin the company's operational stability.
| Year | 2025 | 2024 | 2023 |
|---|---|---|---|
| Free Cash Flow Yield | 4.60% | 3.81% | 3.82% |
| Earnings Yield | 3.61% | 3.19% | 3.63% |
| CAPEX to Operating Cash Flow | 9.35% | 9.74% | 12.54% |
| Stock-based Compensation to Revenue | 0.79% | 0.79% | 0.67% |
| Free Cash Flow / Operating Cash Flow Ratio | 90.65% | 90.26% | 87.46% |
Excellent cashflow stability and sustainable capital efficiency suggest robust internal resource management at IDEX Corporation.
🧮 Balance Sheet & Leverage Analysis
A comprehensive analysis of balance sheet metrics highlights financial health and risk management through leverage. A resilient balance sheet provides a safeguard during market volatilities.
| Year | 2025 | 2024 | 2023 |
|---|---|---|---|
| Debt-to-Equity | 45.21% | 52.34% | 40.83% |
| Debt-to-Assets | 26.29% | 29.45% | 24.65% |
| Debt-to-Capital | 31.13% | 34.36% | 28.99% |
| Net Debt to EBITDA | 1.37 | 1.59 | 0.95 |
| Current Ratio | 3.39 | 2.53 | 2.89 |
| Quick Ratio | 2.02 | 1.85 | 2.05 |
| Financial Leverage | 1.72 | 1.78 | 1.66 |
These figures reveal IDEX Corporation's conservative approach to leverage, maintaining strong liquidity positions and balanced debt management.
💪 Fundamental Strength & Profitability
Profitability and fundamental strength ratios provide a snapshot of the company's return metrics and margins, all essential for assessing overall business success.
| Year | 2025 | 2024 | 2023 |
|---|---|---|---|
| Return on Equity | 11.99% | 13.31% | 16.83% |
| Return on Assets | 6.98% | 7.49% | 10.16% |
| Margins: Net | 13.98% | 15.45% | 18.21% |
| Margins: EBIT | 20.16% | 20.92% | 24.80% |
| Margins: EBITDA | 26.13% | 26.29% | 29.45% |
| Margins: Gross | 44.51% | 46.40% | 49.57% |
| Research & Development to Revenue | 0.54% | 0.54% | 0.54% |
Strong profitability metrics and a commitment to R&D underpin IDEX Corporation's sustainable growth and competitive advantage.
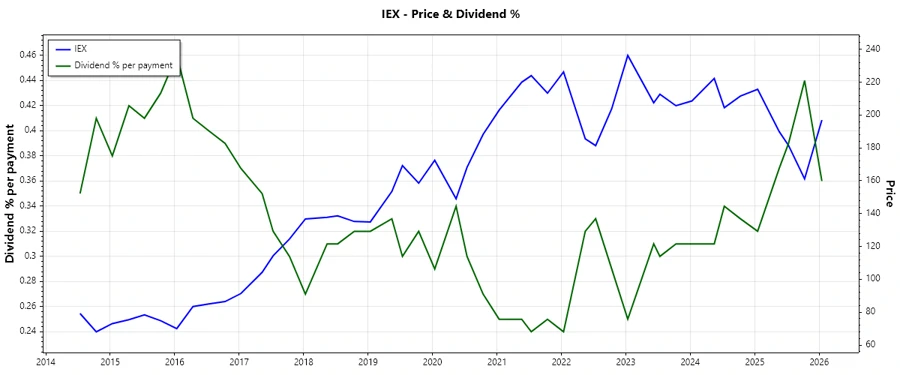
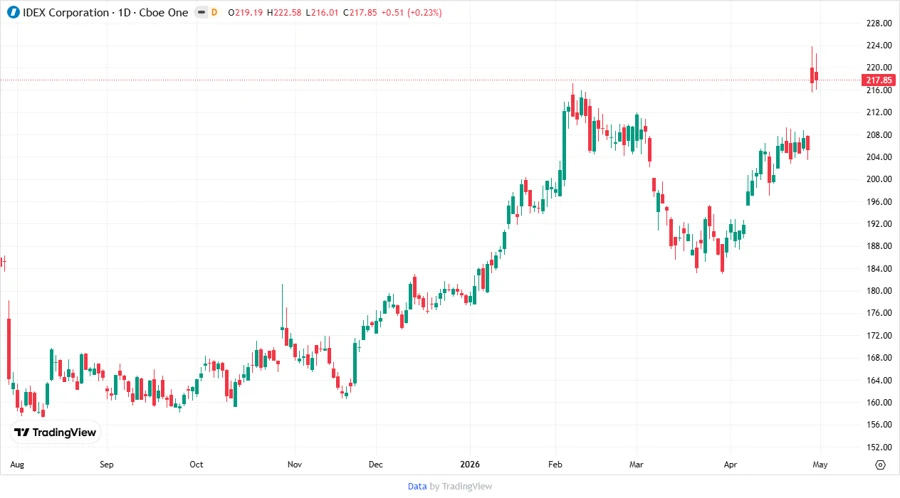
📉 Price Development
🔍 Dividend Scoring System
| Criteria | Score (1-5) | Score Bar |
|---|---|---|
| Dividend yield | 3 | |
| Dividend stability | 5 | |
| Dividend growth | 4 | |
| Payout ratio | 4 | |
| Financial stability | 4 | |
| Dividend continuity | 5 | |
| Cashflow coverage | 4 | |
| Balance Sheet Quality | 5 |
Total Score: 34/40
📈 Rating
IDEX Corporation receives a strong dividend rating, primarily due to its steady and stable dividend payments over the years. Despite a moderate yield, the comprehensive dividend growth and resilient financial structure back up its dividend payouts. It is recommended for long-term investors seeking stability and growth in dividend income.
Smart Data Insight
Master the Perfect Entry & Exit for this Stock
Don't leave your profits to chance. Historically, this stock follows specific seasonal patterns that institutional traders use to maximize returns.
- ✅ Identify the "Golden Buying Window"
- ✅ Avoid high-risk correction cycles
- ✅ Backtested data from the last 20+ years