March 23, 2026 a 03:30 am
IEX: Dividend Analysis - IDEX Corporation
The analysis of IDEX Corporation’s dividend profile showcases its commitment to shareholder returns through dividends. With a history of stable and progressive dividend payments over 32 years, the company demonstrates its financial robustness and dedication to returning value to investors. Despite a moderate dividend yield, IDEX’s consistent growth and stable payout ratios highlight its potential as a long-term, reliable income investment.
Overview 📊
IDEX Corporation operates within the industrial sector, and its dividend metrics exemplify a sustainable approach to rewarding shareholders. This can be particularly appreciated in a volatile market environment where consistent returns are valued.
| Metric | Value |
|---|---|
| Sector | Industrial |
| Dividend yield | 1.44% |
| Current dividend per share | 2.82 USD |
| Dividend history | 32 years |
| Last cut or suspension | None |
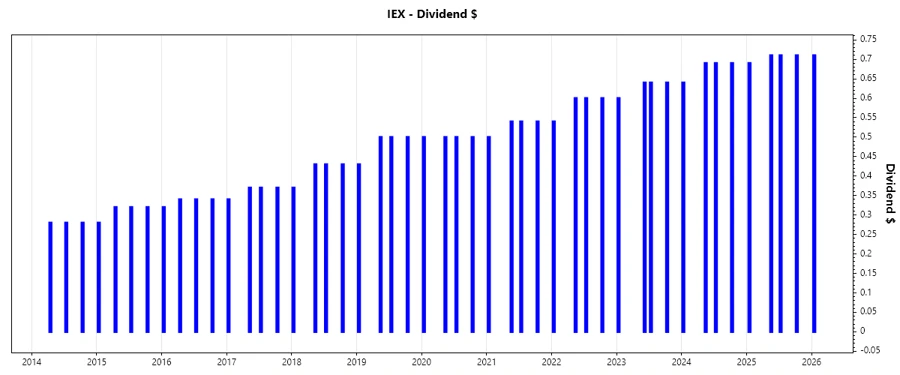
Dividend History 📉
IDEX Corporation's dividend history is vital in assessing the company’s financial health and shareholder-friendly practices. A strong history often suggests stability, making the company appealing to income-focused investors.
| Year | Dividend Per Share (USD) |
|---|---|
| 2026 | 0.71 |
| 2025 | 2.82 |
| 2024 | 2.71 |
| 2023 | 2.52 |
| 2022 | 2.34 |
Dividend Growth 📈
Examining the dividend growth of a company provides insights into its future earnings potential and fiscal health. Continually increasing dividends are indicative of strong, underlying financial growth and investor confidence.
| Time | Growth |
|---|---|
| 3 years | 6.42% |
| 5 years | 7.11% |
The average dividend growth is 7.11% over 5 years. This shows moderate but steady dividend growth.
Payout Ratio ✅
The payout ratio is a critical measure of dividend sustainability. A lower ratio suggests that the company is retaining more earnings for growth or other uses, strengthening future dividend growth potential.
| Key figure | Ratio |
|---|---|
| EPS-based | 43.71% |
| Free cash flow-based | 34.26% |
With a 43.71% EPS payout ratio and a 34.26% FCF payout ratio, IDEX Corporation strides a fine balance between shareholder returns and reinvestment opportunities, indicating well-managed dividend sustainability.
Cashflow & Capital Efficiency 🤑
The cash flow analysis shows how well a company generates cash to cover its debt obligations, fund its capital expenditures, and further business opportunities. It gives insights into operational efficiency.
| Metric | 2025 | 2024 | 2023 |
|---|---|---|---|
| Free Cash Flow Yield | 4.60% | 3.81% | 3.82% |
| Earnings Yield | 3.61% | 3.19% | 3.63% |
| CAPEX to Operating Cash Flow | 9.35% | 9.74% | 12.54% |
| Stock-based Compensation to Revenue | 0.79% | 0.79% | 0.67% |
| Free Cash Flow / Operating Cash Flow Ratio | 90.65% | 90.26% | 87.46% |
The capital and cash flow metrics portray a strong cash generation ability and sufficient reinvestment for future growth, crucial in sustaining long-term dividends.
Balance Sheet & Leverage Analysis 📐
A robust balance sheet indicates financial health and the ability to manage existing debt. These factors are vital for assessing a company's long-term viability.
| Metric | 2025 | 2024 | 2023 |
|---|---|---|---|
| Debt-to-Equity | 0.45 | 0.52 | 0.41 |
| Debt-to-Assets | 0.26 | 0.29 | 0.25 |
| Debt-to-Capital | 0.31 | 0.34 | 0.29 |
| Net Debt to EBITDA | 1.37 | 1.59 | 0.95 |
| Current Ratio | 2.86 | 2.53 | 2.89 |
| Quick Ratio | 2.02 | 1.85 | 2.05 |
| Financial Leverage | 1.72 | 1.78 | 1.66 |
IDEX Corporation’s moderate leverage ratios, along with ample liquidity, hint at balanced financial risk and the capacity to meet its obligations while also funding growth opportunities.
Fundamental Strength & Profitability 📈
Strong fundamentals reflect a company’s efficiency in managing its resources and achieving profitable growth. Key metrics such as ROE and margins highlight profitability.
| Metric | 2025 | 2024 | 2023 |
|---|---|---|---|
| Return on Equity | 11.99% | 13.31% | 16.83% |
| Return on Assets | 6.98% | 7.49% | 10.16% |
| Margins: Net | 13.98% | 15.45% | 18.21% |
| Margins: EBIT | 20.16% | 20.92% | 24.80% |
| Margins: EBITDA | 26.13% | 26.29% | 29.45% |
| Margins: Gross | 44.51% | 46.40% | 49.57% |
| Research & Development to Revenue | 0.00% | 5.46% | 5.37% |
IDEX demonstrates efficient asset management and strong profitability margins, reflecting its fundamental strength and the ability to generate consistent returns for shareholders.
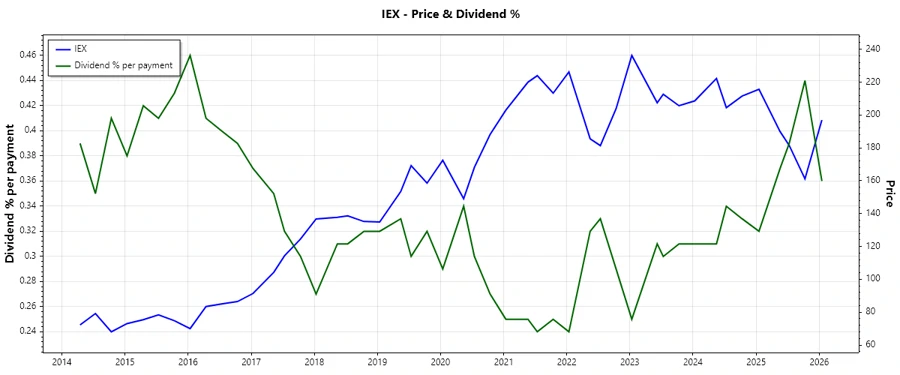
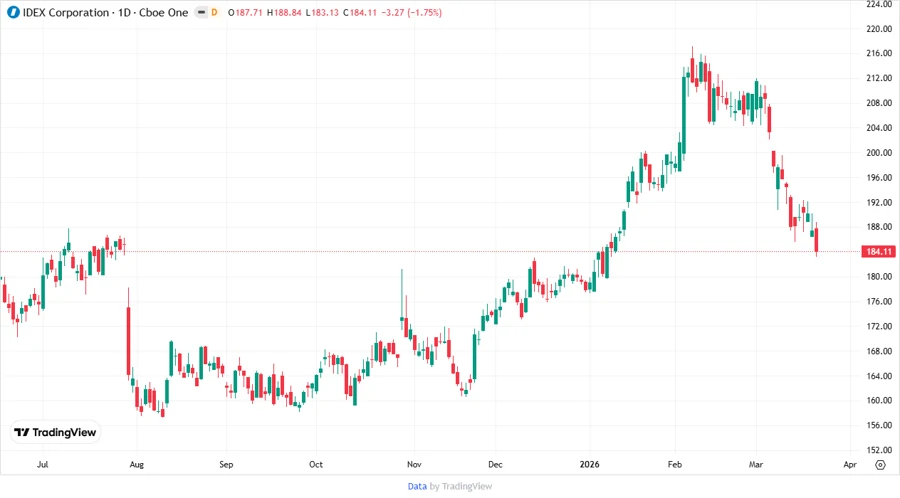
Price Development 📊
Dividend Scoring System 🏆
| Category | Score | Score Bar |
|---|---|---|
| Dividend yield | 3 | |
| Dividend Stability | 5 | |
| Dividend growth | 4 | |
| Payout ratio | 4 | |
| Financial stability | 5 | |
| Dividend continuity | 5 | |
| Cashflow Coverage | 4 | |
| Balance Sheet Quality | 5 |
Overall Score: 35/40
Rating ⭐
Based on the comprehensive dividend analysis, IDEX Corporation exhibits a strong, stable dividend profile supported by robust financial health, reliable cash flows, and prudent payout ratios. This positions it as a solid choice for investors seeking consistent income with moderate growth potential. Recommend for long-term dividend-focused portfolios.