March 18, 2026 a 12:46 pm
IEX: Dividend Analysis - IDEX Corporation
IDEX Corporation presents a diversified profile within the industrial sector. With a robust history of dividend payments spanning over 32 years and a moderate yield of 1.44%, it remains a solid choice for conservative yield-seeking investors. Although the dividend growth of 7.11% over five years indicates moderate but steady improvements, its sustainability is supported by a satisfactory payout ratio.
📊 Overview
As a leading entity in the industrial sector, IDEX Corporation offers potential for stable cash flows and dividends. With a dividend yield of 1.44% and a current dividend of $2.82 per share, the company has maintained uninterrupted dividend payments for over three decades. The last cut or suspension being non-existent underscores its consistent dividend policy.
| Parameter | Details |
|---|---|
| Sector | Industrial |
| Dividend Yield | 1.44% |
| Current Dividend per Share | $2.82 |
| Dividend History | 32 years |
| Last Cut or Suspension | None |
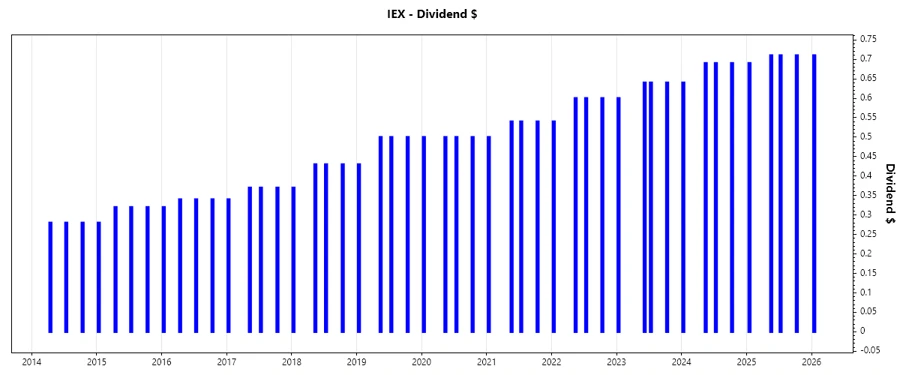
📈 Dividend History
The dividend history of IDEX Corporation is a testament to its financial robustness and commitment to returning value to shareholders. This history indicates a strong capacity to generate sufficient cash flows to support steady dividend growth.
| Year | Dividend per Share (USD) |
|---|---|
| 2026 | $0.71 |
| 2025 | $2.82 |
| 2024 | $2.71 |
| 2023 | $2.52 |
| 2022 | $2.34 |
📊 Dividend Growth
Over the past years, IDEX Corporation has exhibited a stable dividend growth trajectory, signaling the potential for long-term shareholder returns. The 3-year growth rate of 6.42% compared to the 5-year rate of 7.11% emphasizes consistent enhancement in shareholder value.
| Time | Growth |
|---|---|
| 3 years | 6.42% |
| 5 years | 7.11% |
The average dividend growth is 7.11% over 5 years. This shows moderate but steady dividend growth.
🗣️ Payout Ratio
The payout ratios are essential to assess dividend sustainability. With an EPS-based payout ratio of 43.71% and a free cash flow-based ratio of 34.26%, IDEX Corporation portrays prudent financial management, ensuring dividends are well covered by earnings and cash flows.
| Key Figure | Ratio |
|---|---|
| EPS-based | 43.71% |
| Free cash flow-based | 34.26% |
These payout ratios indicate that the company’s dividends are well-covered, highlighting financial stability and responsible payout policies.
✅ Cashflow & Capital Efficiency
Assessing cash flow and capital efficiency is vital for understanding the company's ability to sustain its dividend payouts and support growth initiatives. IDEX Corporation displays healthy free cash flow and operational efficiency metrics.
| Metric | 2023 | 2024 | 2025 |
|---|---|---|---|
| Free Cash Flow Yield | 3.82% | 3.81% | 4.60% |
| Earnings Yield | 3.63% | 3.19% | 3.61% |
| CAPEX to Operating Cash Flow | 12.54% | 9.74% | 9.35% |
| Stock-based Compensation to Revenue | 0.67% | 0.79% | 0.79% |
| Free Cash Flow / Operating Cash Flow Ratio | 87.46% | 90.26% | 90.65% |
IDEX Corporation’s cash flow metrics are robust, highlighting strong cash generation capacity and operational effectiveness, crucial for maintaining steady dividend payments.
⚠️ Balance Sheet & Leverage Analysis
The balance sheet and leverage analysis provides insight into financial stability risk associated with capital structure. IDEX Corporation exhibits a sound balance sheet structure, sustaining low leverage ratios and adequate liquidity.
| Metric | 2023 | 2024 | 2025 |
|---|---|---|---|
| Debt-to-Equity | 0.41 | 0.52 | 0.45 |
| Debt-to-Assets | 24.65% | 29.45% | 26.29% |
| Debt-to-Capital | 28.99% | 34.36% | 31.13% |
| Net Debt to EBITDA | 0.95 | 1.59 | 1.37 |
| Current Ratio | 2.89 | 2.53 | 2.86 |
| Quick Ratio | 2.05 | 1.85 | 2.02 |
| Financial Leverage | 1.66 | 1.78 | 1.72 |
IDEX Corporation maintains a strong balance sheet with conscientious leverage and liquidity management, supporting its ability to weather economic fluctuations without jeopardizing dividend payments.
📉 Fundamental Strength & Profitability
The fundamental strength and profitability indicate operational competence and potential shareholder returns. IDEX Corporation’s returns and margins suggest effective cost management and value generation for shareholders.
| Metric | 2023 | 2024 | 2025 |
|---|---|---|---|
| Return on Equity | 16.83% | 13.31% | 11.99% |
| Return on Assets | 10.16% | 7.49% | 6.98% |
| Net Margin | 18.21% | 15.45% | 13.98% |
| EBIT Margin | 24.80% | 20.92% | 20.16% |
| EBITDA Margin | 29.45% | 26.29% | 26.13% |
| Gross Margin | 49.57% | 46.40% | 44.51% |
| R&D to Revenue | 5.37% | 5.46% | 0% |
IDEX Corporation's profitability metrics indicate effective margin management and a solid return on equity and assets, reflecting operational efficacy and shareholder value creation.
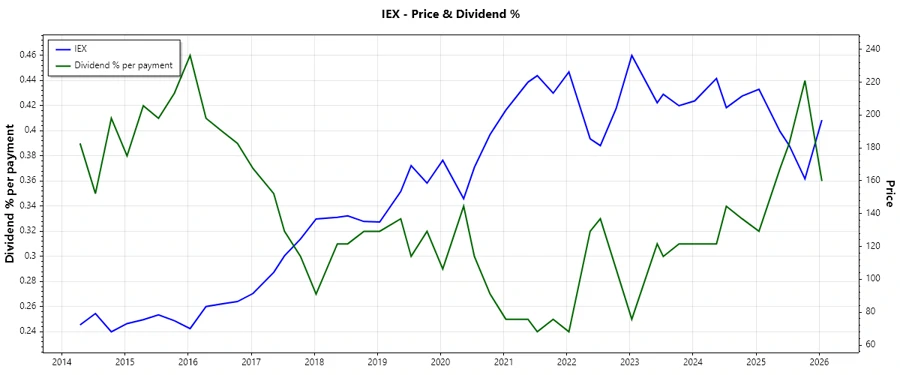
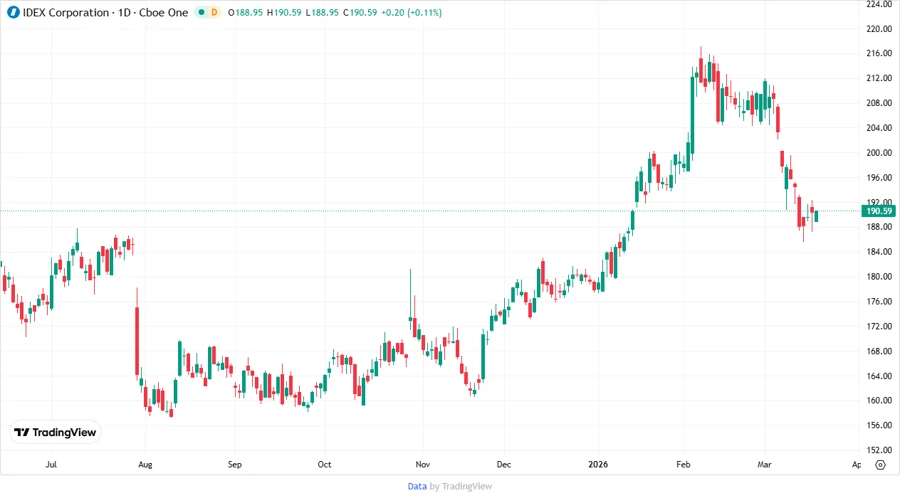
📈 Price Development
✅ Dividend Scoring System
| Criteria | Score | Bar |
|---|---|---|
| Dividend Yield | 3 | |
| Dividend Stability | 5 | |
| Dividend Growth | 4 | |
| Payout Ratio | 5 | |
| Financial Stability | 5 | |
| Dividend Continuity | 5 | |
| Cashflow Coverage | 5 | |
| Balance Sheet Quality | 5 |
Total Score: 37/40
Rating
In conclusion, IDEX Corporation showcases a commendable profile as a dividend-paying stock, fortified by its resilient financial fundamentals and stable dividend growth strategy. It is a conducive option for investors aiming for long-term stable income with moderate growth prospects. Given the impressive scoring of 37 out of 40, IDEX Corporation deserves a strong endorsement, favorable for risk-averse income investors.