March 18, 2026 a 02:03 pm
IDXX: Trend and Support & Resistance Analysis - IDEXX Laboratories, Inc.
IDXX Laboratories, Inc. has been experiencing significant market movements recently. With its core business focusing on veterinary and diagnostic services worldwide, the company serves a niche and growing sector. The current stock trend analysis and support & resistance levels can help us understand potential future movements. Below, we dive into the technical analysis based on recent price data to assess the next steps for potential investors and analysts.
Trend Analysis
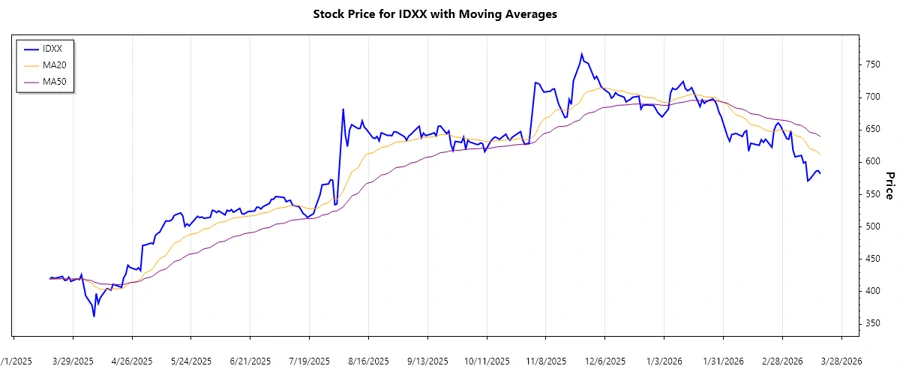
Based on the recent price data for IDXX Laboratories, Inc., we calculated the 20-day and 50-day exponential moving averages (EMA) to determine the market trend. The results are showcased below:
| Date | Close Price | Trend |
|---|---|---|
| 2026-03-18 | 582.1 | ▼ Abwärtstrend |
| 2026-03-17 | 586.98 | ▼ Abwärtstrend |
| 2026-03-16 | 586.37 | ▼ Abwärtstrend |
| 2026-03-13 | 573.82 | ▼ Abwärtstrend |
| 2026-03-12 | 571.21 | ▼ Abwärtstrend |
| 2026-03-11 | 600.52 | ▼ Abwärtstrend |
| 2026-03-10 | 598.85 | ▼ Abwärtstrend |
The EMA calculations indicate a consistent downward trend (EMA20 < EMA50), suggesting bearish momentum in recent trading sessions. Stockholders and potential investors are advised to closely monitor these indicators for potential trend reversals.
Support- and Resistance
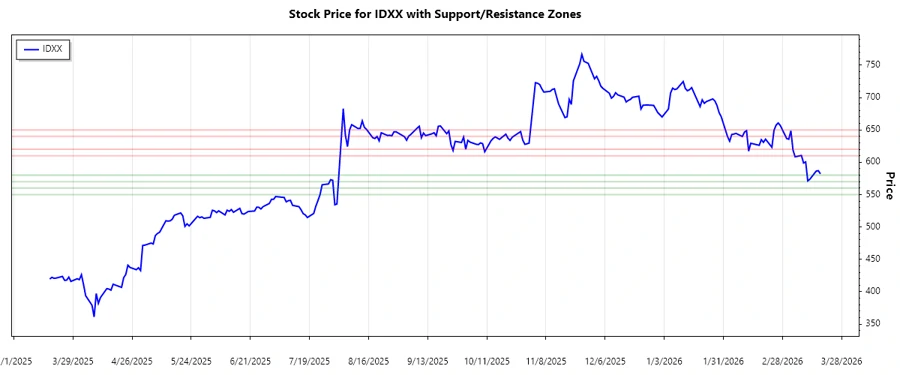
A careful analysis of IDXX's price movements reveals key levels that serve as potential support and resistance zones. These levels can be pivotal for traders looking to set strategic entry and exit points.
| Zone | Price Range |
|---|---|
| Support Zone 1 | 570 ↔ 580 |
| Support Zone 2 | 550 ↔ 560 |
| Resistance Zone 1 | 610 ↔ 620 |
| Resistance Zone 2 | 640 ↔ 650 |
As of the most recent close, the stock is near the upper edge of a support zone, potentially priming for a bounce. A dip below this level could lead to further losses.
Conclusion
The stock of IDEXX Laboratories, Inc. is currently in a downtrend, with vital support levels nearing a test. Risk-tolerant investors might view the support testing as a potential entry point, though caution is advised given the bearish trend. Conversely, resistance levels can act as logical thresholds for profit-taking or short entries. Going forward, close monitoring of market conditions and responsiveness to data-driven signals will be crucial in decision-making processes for traders and investors.