October 14, 2025 a 02:03 pm

IDXX: Trend and Support & Resistance Analysis - IDEXX Laboratories, Inc.
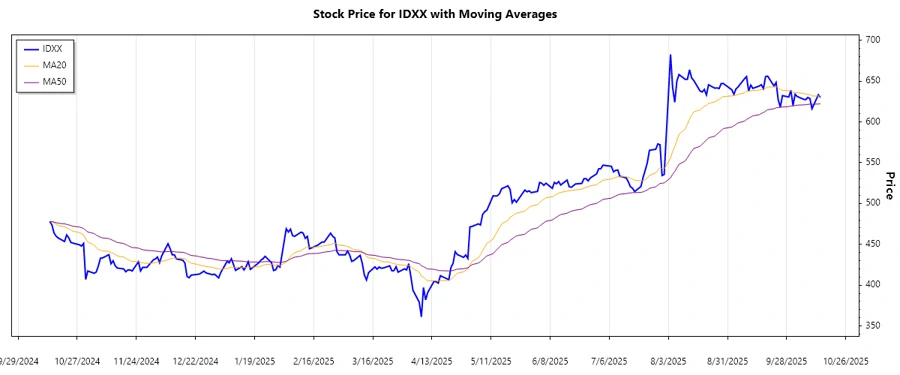
The stock of IDEXX Laboratories, Inc. has demonstrated considerable volatility over the past few months, reflecting both market dynamics and sector-specific developments. Technical analysis provides insights into potential uptrends or downtrends and identifies key support and resistance levels. With its diverse portfolio in veterinary, livestock, and water testing markets, the company remains a significant player and is closely watched by investors analyzing its market performance.
Trend Analysis
The following table presents a summarization of the trend over the last seven days based on the closing prices.
| Date | Close Price | Trend |
|---|---|---|
| 2025-10-14 | 630.11 | ▲ |
| 2025-10-13 | 633.32 | ▲ |
| 2025-10-10 | 616.15 | ▼ |
| 2025-10-09 | 628.75 | ▲ |
| 2025-10-08 | 629.91 | ▲ |
| 2025-10-07 | 627.28 | ▲ |
| 2025-10-06 | 627.78 | ▲ |
Calculation of EMA indicates an overall positive momentum, with EMA20 favored over EMA50, suggesting a consistent uptrend in the examining period.
Support- and Resistance Analysis
Based on the technical analysis, the following support and resistance zones have been identified.
| Zone Type | Zone Range |
|---|---|
| Support Zone 1 | 620.00 - 625.00 ▼ |
| Support Zone 2 | 610.00 - 615.00 ▼ |
| Resistance Zone 1 | 635.00 - 640.00 ▲ |
| Resistance Zone 2 | 645.00 - 650.00 ▲ |
The current close price is trading close to the upper support zone, indicating potential for resistance breakout if followed by stronger momentum.
Conclusion
IDEXX Laboratories, Inc. continues to exhibit resilience in its stock market performance. The analyzed data suggests an uptrend momentum, driven by positive sentiment and market influences. The proximity to resistance zones poses a question of potential breakthroughs or consolidations, aligned with broader market trends. Analysts will be closely monitoring these dynamics to assess the stock's directionality and future performance, factoring in external market conditions and the company's internal strategies for growth and sustainability.
Smart Data Insight
Master the Perfect Entry & Exit for this Stock
Don't leave your profits to chance. Historically, this stock follows specific seasonal patterns that institutional traders use to maximize returns.
- ✅ Identify the "Golden Buying Window"
- ✅ Avoid high-risk correction cycles
- ✅ Backtested data from the last 20+ years