September 22, 2025 a 09:03 am
IDXX: Trend and Support & Resistance Analysis - IDEXX Laboratories, Inc.
IDEXX Laboratories, Inc., operating in the veterinary and water testing sectors, has seen a dynamic stock performance over recent months. The stock has shown a recovery phase after experiencing significant volatility. This analysis provides an insight into the current trends and potential support and resistance levels that could guide future price movements.
Trend Analysis
| Date | Closing Price | Trend |
|---|---|---|
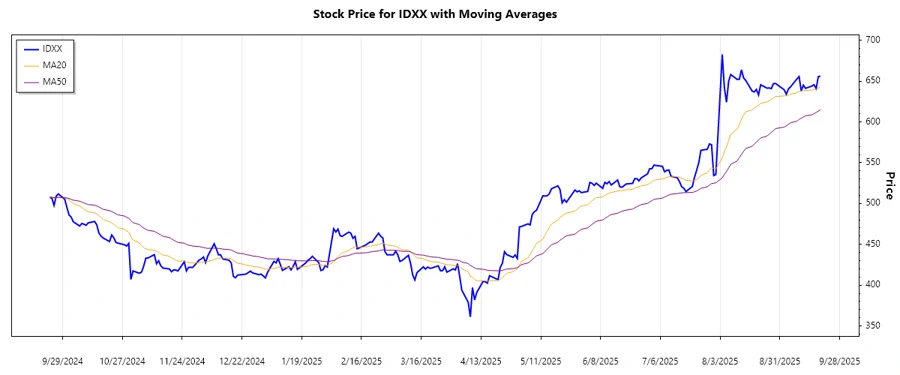
| 2025-09-19 | 656.16 | ▲ Uptrend |
| 2025-09-18 | 655.51 | ▲ Uptrend |
| 2025-09-17 | 640.86 | ▼ Downtrend |
| 2025-09-16 | 645.65 | ▲ Uptrend |
| 2025-09-15 | 643.99 | ▼ Downtrend |
| 2025-09-12 | 641.14 | ▼ Downtrend |
| 2025-09-11 | 645.16 | ▲ Uptrend |
The current trend is an ▲ Uptrend, with the EMA20 above the EMA50. This indicates a bullish sentiment, supported by ascending price formations.
Support and Resistance
| Zone Type | From | To |
|---|---|---|
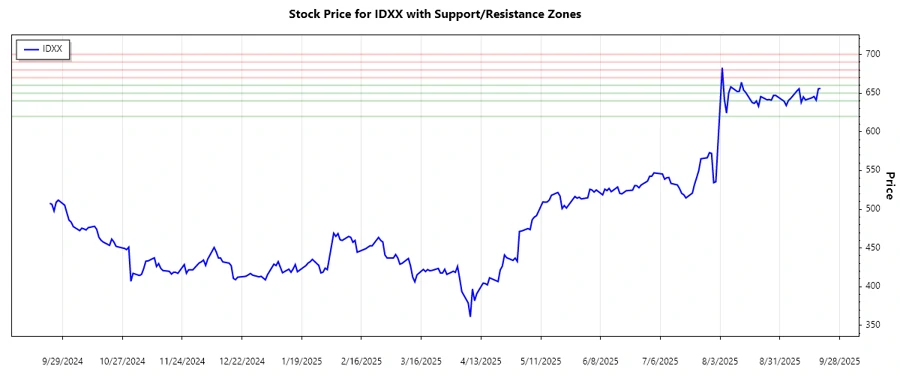
| Support 1 | 620.00 | 640.00 |
| Support 2 | 650.00 | 660.00 |
| Resistance 1 | 670.00 | 680.00 |
| Resistance 2 | 690.00 | 700.00 |
The current price is within the Resistance 1 zone, suggesting potential selling pressure. A breakout might indicate further upward movement.
Conclusion
IDEXX Laboratories, Inc. is currently in a bullish phase, with an upward trend supported by the EMA crossovers. The proximity to resistance levels suggests caution, as a breakout or rejection could define future movements. Analysts should monitor these levels for indications of sustained momentum or reversal potential. The stock’s performance is indicative of broader market confidence in the company's operational domain.
Smart Data Insight
Master the Perfect Entry & Exit for this Stock
Don't leave your profits to chance. Historically, this stock follows specific seasonal patterns that institutional traders use to maximize returns.
- ✅ Identify the "Golden Buying Window"
- ✅ Avoid high-risk correction cycles
- ✅ Backtested data from the last 20+ years