November 14, 2025 a 03:15 pm

IDXX: Fibonacci Analysis - IDEXX Laboratories, Inc.
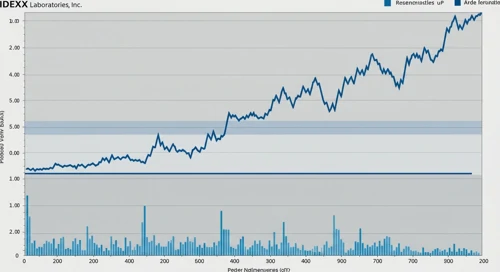
Over recent months, IDEXX Laboratories, Inc. (IDXX) has exhibited a notable uptrend, reflecting strong performance backed by its robust sales in veterinary diagnostics. Investors have shown confidence, possibly due to positive market conditions and strategic product developments. However, the stock's future movement could be influenced by broader economic factors and sector-specific challenges.
Fibonacci Analysis
Analyzing the stock data for IDEXX Laboratories from the recent months, a significant uptrend is detected as the dominant pattern in the market. The analysis is conducted from the low on April 8, 2025, to the high on November 3, 2025. Based on the identified trend, Fibonacci retracement levels have been calculated, which help identify potential support and resistance levels investors might consider.
| Trend Start Date | Trend End Date | High (Price & Date) | Low (Price & Date) |
|---|---|---|---|
| 2025-04-08 | 2025-11-03 | $722.94 (2025-11-03) | $361.04 (2025-04-08) |
| Fibonacci Level | Price Level |
|---|---|
| 0.236 | $462.82 |
| 0.382 | $516.53 |
| 0.5 | $542.99 |
| 0.618 | $569.45 |
| 0.786 | $612.34 |
Currently, the stock price of $695.26 is not within any major Fibonacci retracement zone, suggesting it remains above the significant retracement levels identified. This characteristic can be interpreted as a signal for potential support above the 0.786 level, with continued upward momentum being a possibility.
Conclusion
IDEXX Laboratories, Inc. has shown a substantial uptrend over recent months, positioning itself as a stable investment for those seeking exposure to the veterinary diagnostics industry. The strength of this trend could continue to offer favorable returns, though attention should be paid to potential overbought conditions or macroeconomic factors that could trigger a reversal. Analysts should consider the current price strength above the primary Fibonacci levels as a positive sign but remain vigilant of the broader market dynamics that might alter the stock's trajectory.
Smart Data Insight
Master the Perfect Entry & Exit for this Stock
Don't leave your profits to chance. Historically, this stock follows specific seasonal patterns that institutional traders use to maximize returns.
- ✅ Identify the "Golden Buying Window"
- ✅ Avoid high-risk correction cycles
- ✅ Backtested data from the last 20+ years