November 10, 2025 a 11:44 am

IDXX: Fibonacci Analysis - IDEXX Laboratories, Inc.
IDEXX Laboratories, Inc. has shown a significant uptrend over the past months, reflecting its strong market position and innovation in the veterinary diagnostics industry. This uptrend has been underpinned by robust product demand and strategic market expansions. With a keen focus on research and development, IDEXX's growth trajectory looks promising despite competitive pressures in the sector.
Fibonacci Analysis
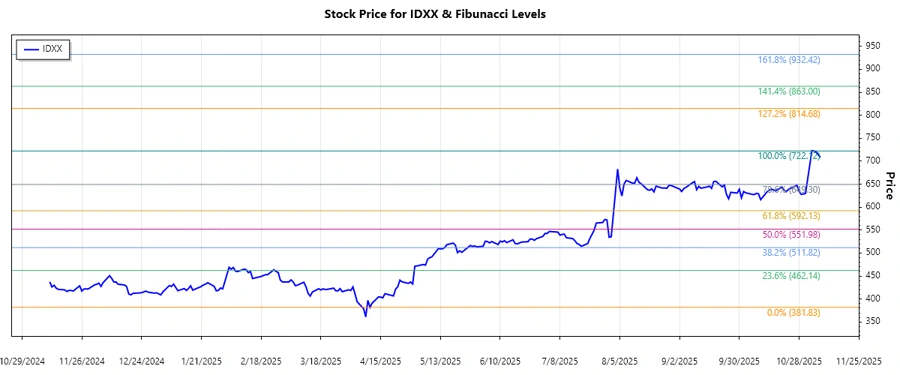
The analysis reveals a dominant uptrend starting from April 10, 2025, to November 5, 2025. During this period, the stock's price increased from a low of 381.83 to a high of 722.12.
| Description | Value |
|---|---|
| Start Date of Trend | 2025-04-10 |
| End Date of Trend | 2025-11-05 |
| High Point | $722.12 on 2025-11-05 |
| Low Point | $381.83 on 2025-04-10 |
Fibonacci Retracement Levels
| Level | Price |
|---|---|
| 0.236 | $618.42 |
| 0.382 | $566.19 |
| 0.5 | $551.98 |
| 0.618 | $533.77 |
| 0.786 | $508.88 |
As of the latest data, the stock is trading at $708.45, which remains above the 0.236 Fibonacci level. This indicates a strong bullish sentiment with potential new highs being explored.
The current price positions the stock within its historical high, providing a significant support level. In technical analysis terms, the nearest support is identified at the 0.236 level, while $722.12 could act as a formidable resistance in the short term.
Stock price trend and Fibonacci levels chart for IDEXX Laboratories, Inc.
Conclusion
IDEXX Laboratories, Inc.'s robust uptrend suggests a strong technical footing bolstered by continual growth in their business segments. With the stock trading above its key Fibonacci levels, it stands on a solid foundation in anticipation of further bullish moves. Nonetheless, any retracement should be monitored closely, especially toward the 0.236 level, which could challenge the current uptrend. Investors might consider the company's innovative edge and market penetration in a competitive landscape as positive long-term prospects.