September 11, 2025 a 04:44 pm
IDXX: Fibonacci Analysis - IDEXX Laboratories, Inc.
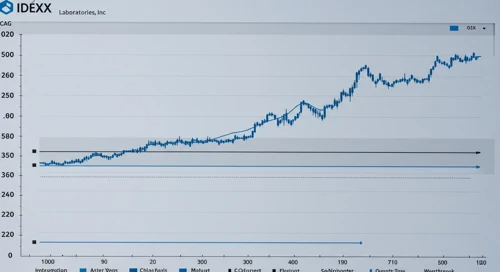
IDEXX Laboratories, Inc. is an innovative leader in the veterinary products and services field. The company's stock has demonstrated significant growth over recent months. However, understanding possible price reversals is crucial for making informed investment decisions. This analysis focuses on identifying key areas using Fibonacci retracement, shedding light on potential support and resistance levels essential for gauging future movements.
Fibonacci Analysis
| Details | Information |
|---|---|
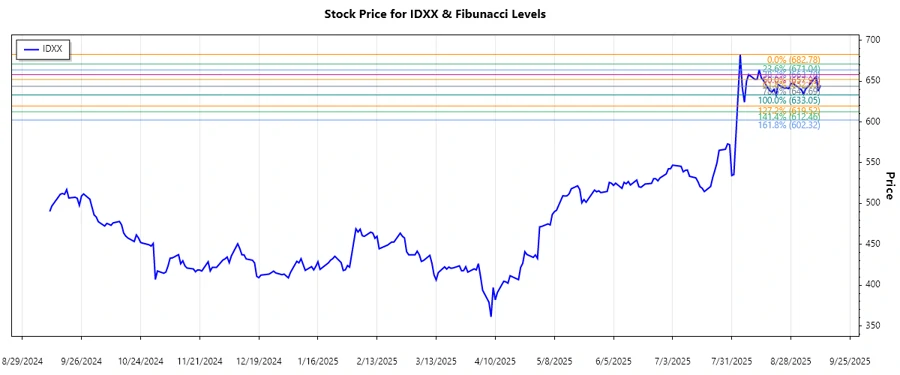
| Trend Period | 2025-08-04 to 2025-09-09 |
| High Point | $682.78 on 2025-08-04 |
| Low Point | $633.05 on 2025-08-21 |
| Fibonacci Level | Price Level |
|---|---|
| 0.236 | $671.50 |
| 0.382 | $662.00 |
| 0.5 | $657.92 |
| 0.618 | $653.83 |
| 0.786 | $645.31 |
The current price of $644.85 resides near the 0.786 Fibonacci retracement level, indicating a strong possibility of support at this price. Further analysis may suggest a consolidation phase before any significant price action.
Conclusion
The analysis of IDEXX Laboratories, Inc. suggests the presence of potential support around the 0.786 Fibonacci level. While this zone might offer a favorable entry point for traders anticipating a bounce, caution should be exercised given the proximity to support. Investors should monitor for confirmation signals, with risks of further declines if support fails. Overall, understanding these technical levels can assist in making strategic decisions in line with market trends.
Smart Data Insight
Master the Perfect Entry & Exit for this Stock
Don't leave your profits to chance. Historically, this stock follows specific seasonal patterns that institutional traders use to maximize returns.
- ✅ Identify the "Golden Buying Window"
- ✅ Avoid high-risk correction cycles
- ✅ Backtested data from the last 20+ years