August 17, 2025 a 05:15 am
IDXX: Fibonacci Analysis - IDEXX Laboratories, Inc.
IDEXX Laboratories, Inc. has been showing significant growth in its stock price over the last few months. This upward momentum indicates positive investor sentiment towards its performance in the veterinary and diagnostics market. Despite global market fluctuations, the company's innovative solutions and robust product offering continue to strengthen its position, attracting both short-term and long-term investors.
Fibonacci Analysis
| Criteria | Details |
|---|---|
| Trend Period | 2024-09-11 to 2025-08-14 |
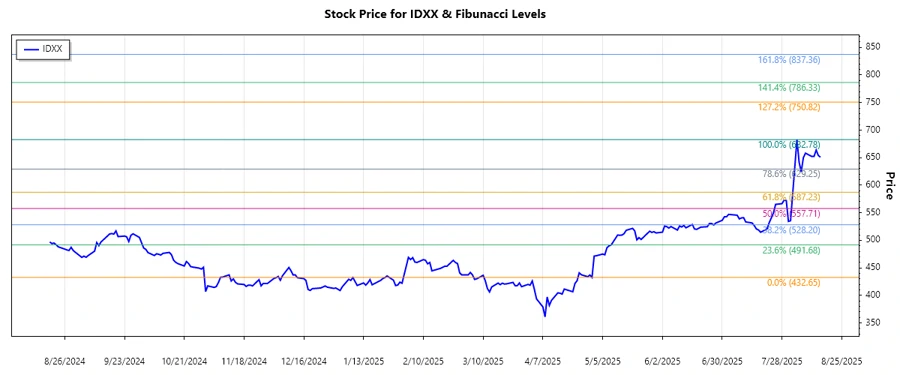
| High Point | $682.78 on 2025-08-04 |
| Low Point | $432.65 on 2024-04-30 |
| Current Price | $650.84 |
| Retracement Levels |
0.236: $572.25 0.382: $598.53 0.5: $616.72 0.618: $634.91 0.786: $659.89 |
| Retracement Zone | 0.618 |
| Technical Interpretation | The current price of $650.84 is within the 0.618 retracement level, suggesting potential support. This level often signifies a strong area where buying interest may increase, leading to price stabilization or a potential reversal back to an uptrend. |
Conclusion
The upward trend of IDEXX Laboratories, Inc. shows promising potential, with the stock consistently achieving new highs in recent months. However, with the current price lying within the critical retracement level of 0.618, there exists a notable support that may buffer against potential downturns. Analysts should note this level as a focal point for evaluating future price stability or upward momentum. While the company positions itself for increased market share, investors should remain cautious of global economic shifts that can impact market performance.
Smart Data Insight
Master the Perfect Entry & Exit for this Stock
Don't leave your profits to chance. Historically, this stock follows specific seasonal patterns that institutional traders use to maximize returns.
- ✅ Identify the "Golden Buying Window"
- ✅ Avoid high-risk correction cycles
- ✅ Backtested data from the last 20+ years