October 31, 2025 a 06:44 am
ICE: Fibonacci Analysis - Intercontinental Exchange, Inc.
Intercontinental Exchange, Inc. (ICE) operates a diverse network of exchanges and clearing houses, and is a significant player in the trading of derivatives and financial securities. The stock has experienced price fluctuations over the past months, facing challenges in the increasingly competitive environment in which it operates. Looking at the historical trading data, we now perform a detailed Fibonacci analysis to gain insights into its potential technical levels.
Fibonacci Analysis
| Parameter | Details |
|---|---|
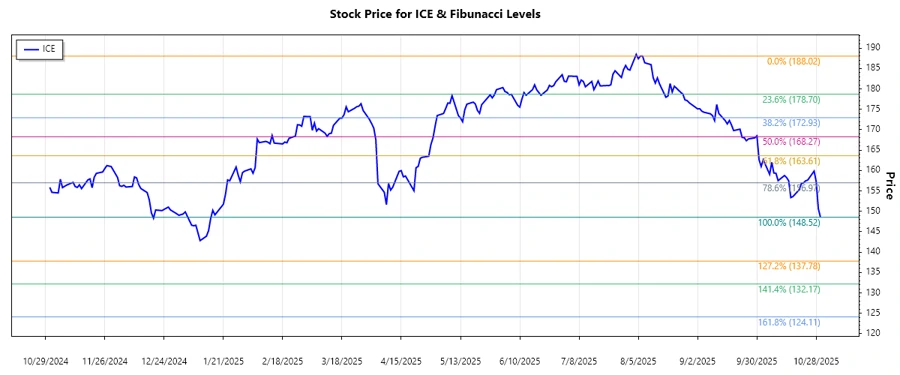
| Trend Type | Downtrend |
| Start Date | 2025-08-11 |
| End Date | 2025-10-30 |
| High Price and Date | $188.02 on 2025-08-11 |
| Low Price and Date | $148.52 on 2025-10-30 |
| Fibonacci Levels |
|
| Current Price | $148.52 |
| Retracement Zone | None |
| Interpretation | The current price of $148.52 is below the lowest Fibonacci retracement level of 0.236, indicating a bearish sentiment. |
Conclusion
Based on the technical analysis, Intercontinental Exchange, Inc. (ICE) is experiencing a downward trend. The current price sits below the calculated Fibonacci retracement levels, suggesting a bearish outlook in the market. Fibonacci levels indicate potential areas of support or resistance, but ICE's price falling below these levels might indicate further declines unless a reversal occurs. The market environment and business segments ICE operates within require careful watch for any fundamental changes that could impact stock movement. Thus, while there may be risks due to external factors and market sentiment, potential reversal signs, if accompanied by an improvement in market conditions, could offer a buying opportunity for investors looking at long-term value.
Smart Data Insight
Master the Perfect Entry & Exit for this Stock
Don't leave your profits to chance. Historically, this stock follows specific seasonal patterns that institutional traders use to maximize returns.
- ✅ Identify the "Golden Buying Window"
- ✅ Avoid high-risk correction cycles
- ✅ Backtested data from the last 20+ years