September 04, 2025 a 04:44 pm
ICE: Fibonacci Analysis - Intercontinental Exchange, Inc.
The Intercontinental Exchange, Inc. (ICE) stock has shown significant activity in recent months. The company's strategic diversification across financial services positions it well, reflecting in its stock price movements. A detailed technical analysis suggests a developing trend that investors should monitor closely.
Fibonacci Analysis
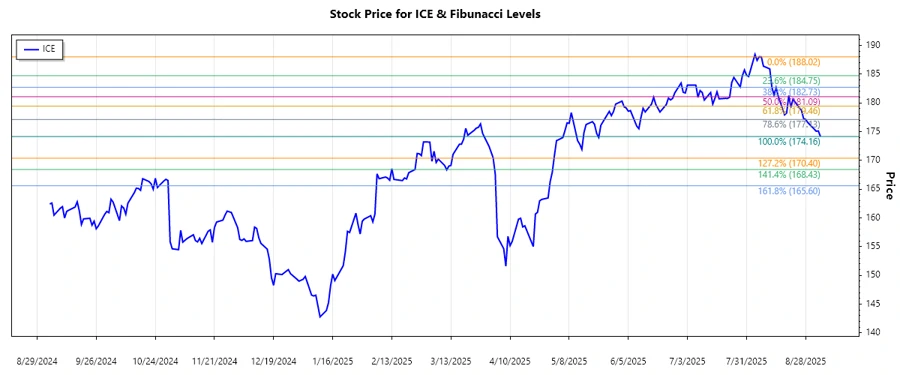
Based on historical price analysis, ICE stock appears to exhibit a downward trend from its peak over the last recorded months extending back to early 2025.
| Period | Date | Price |
|---|---|---|
| Start Date | 2025-08-07 | 188.02 |
| End Date | 2025-09-04 | 174.165 |
| High | 2025-08-07 | 188.02 |
| Low | 2025-09-04 | 174.165 |
Fibonacci Retracement Levels
| Level | Price |
|---|---|
| 0.236 | 184.9599 |
| 0.382 | 182.09797 |
| 0.5 | 180.5925 |
| 0.618 | 179.08703 |
| 0.786 | 176.0439 |
The current price of ICE stock is $174.165, which suggests the stock is hovering close to the 0.786 Fibonacci retracement level. This could imply potential support at the 176.0439 level unless it breaks further below.
Technically, this area could act as a strong support level, signaling a potential reversal or continuation of the downward trend based on upcoming market movements.
Conclusion
The Intercontinental Exchange, Inc. stock presents an intriguing case with mixed opportunities and risks as the financial markets show volatility. A detailed Fibonacci analysis indicates potential support at current levels. Analysts might see a consolidation pattern developing, pointing to cautious optimism if the stock can maintain support. However, continued downward pressure might suggest revisiting strategic decisions around trades related to ICE. Capitalizing on its international spread, investors may find value depending on global economic trends.
Smart Data Insight
Master the Perfect Entry & Exit for this Stock
Don't leave your profits to chance. Historically, this stock follows specific seasonal patterns that institutional traders use to maximize returns.
- ✅ Identify the "Golden Buying Window"
- ✅ Avoid high-risk correction cycles
- ✅ Backtested data from the last 20+ years