May 24, 2026 a 03:30 am

ICE: Dividend Analysis - Intercontinental Exchange, Inc.
Intercontinental Exchange, Inc. showcases a promising dividend profile with consistent payments over 14 years. The dividend yield is moderate at 1.36%, yet the company has demonstrated stable growth. Notably, there have been no historical cuts or suspensions, reinforcing its reliability for investors focusing on stable income streams.
📊 Overview
| Metric | Details |
|---|---|
| Sector | Technology |
| Dividend yield | 1.36% |
| Current dividend per share | 1.935 USD |
| Dividend history | 14 years |
| Last cut or suspension | None |
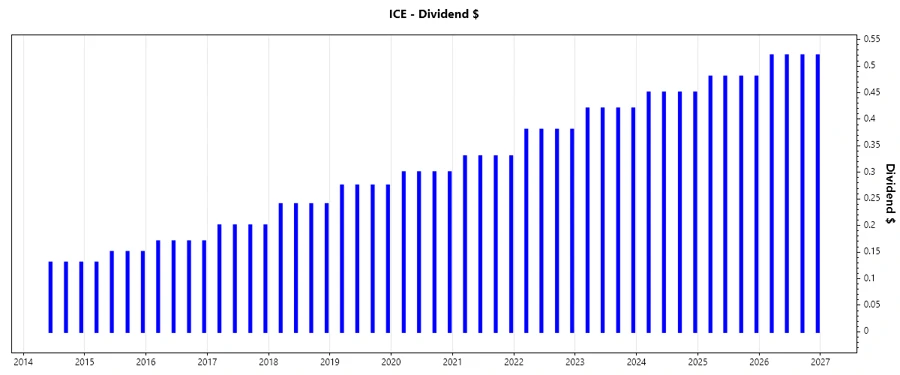
🗣️ Dividend History
The dividend history reflects the company's commitment to returning value to stakeholders. Stability and growth in dividends signal confidence in future earnings and cash flow prospects, enhancing investor appeal.
| Year | Dividend Per Share (USD) |
|---|---|
| 2026 | 2.08 |
| 2025 | 1.92 |
| 2024 | 1.80 |
| 2023 | 1.68 |
| 2022 | 1.52 |
📈 Dividend Growth
The dividend growth metrics highlight an ability to enhance shareholder value via increasing payouts. This upward trend is critical for combating inflation and enhancing income over time.
| Time | Growth |
|---|---|
| 3 years | 8.10% |
| 5 years | 9.86% |
The average dividend growth is 9.86% over 5 years. This shows moderate but steady dividend growth.
📉 Payout Ratio
Payout ratios serve as a critical indicator of dividend sustainability. They gauge the portion of earnings and free cash flow distributed to shareholders, balancing reinvestment needs.
| Key figure | Ratio |
|---|---|
| EPS-based | 27.98% |
| Free cash flow-based | 24.00% |
With an EPS payout ratio of 27.98% and a FCF payout ratio of 24.00%, Intercontinental Exchange, Inc. maintains a conservative approach, ensuring sufficient capital for operational needs and growth initiatives.
🛠️ Cashflow & Capital Efficiency
Assessing cashflow and capital efficiency provides insights into operational health and the ability to finance growth and dividends. These ratios underscore the company's ability to sustainably fund dividends and capital projects.
| Metric | 2023 | 2024 | 2025 |
|---|---|---|---|
| Free Cash Flow Yield | 4.21% | 4.92% | 4.64% |
| Earnings Yield | 3.27% | 3.23% | 3.57% |
| CAPEX to Operating Cash Flow | 13.81% | 8.81% | 8.00% |
| Stock-based Compensation to Revenue | 2.60% | 1.96% | 1.88% |
| Free Cash Flow / Operating Cash Flow Ratio | 86.19% | 91.19% | 91.99% |
The financial stability and efficient capital allocation signal robust cash flow stability and bolster confidence in continued capital returns to shareholders.
🧮 Balance Sheet & Leverage Analysis
A comprehensive analysis of the balance sheet and leverage ratios is essential to assess financial stability, liquidity position, and the structuring of the debt load.
| Metric | 2023 | 2024 | 2025 |
|---|---|---|---|
| Debt-to-Equity | 89.09% | 74.88% | 70.13% |
| Debt-to-Assets | 16.84% | 14.85% | 14.81% |
| Debt-to-Capital | 47.12% | 42.82% | 41.22% |
| Net Debt to EBITDA | 4.48 | 3.27 | 2.93 |
| Current Ratio | 1.004 | 0.995 | 1.020 |
| Quick Ratio | 1.004 | 0.995 | 1.020 |
| Financial Leverage | 5.29 | 5.04 | 4.73 |
The precise balance sheet indicators suggest robust financial prowess and prudent leverage, setting the stage for sustainable policy support and strategic investments.
✅ Fundamental Strength & Profitability
Assessing fundamental strength and profitability ratios gives insight into operational efficiency and potential returns, driving shareholder value through profitability and investment strategies.
| Metric | 2023 | 2024 | 2025 |
|---|---|---|---|
| Return on Equity | 9.21% | 9.96% | 11.43% |
| Return on Assets | 1.74% | 1.98% | 2.41% |
| Margins: Net | 23.91% | 23.42% | 26.14% |
| Margins: EBIT | 37.38% | 38.59% | 40.22% |
| Margins: EBITDA | 49.65% | 51.65% | 52.56% |
| Margins: Gross | 57.14% | 55.45% | 61.88% |
Intercontinental Exchange, Inc. outperforms in fundamental and profitability metrics, reflecting robust operational efficiency, fortified by strong ROE and net margins.
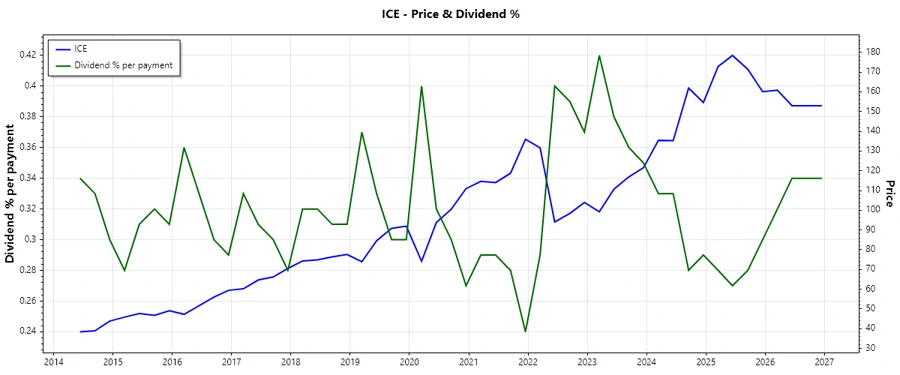
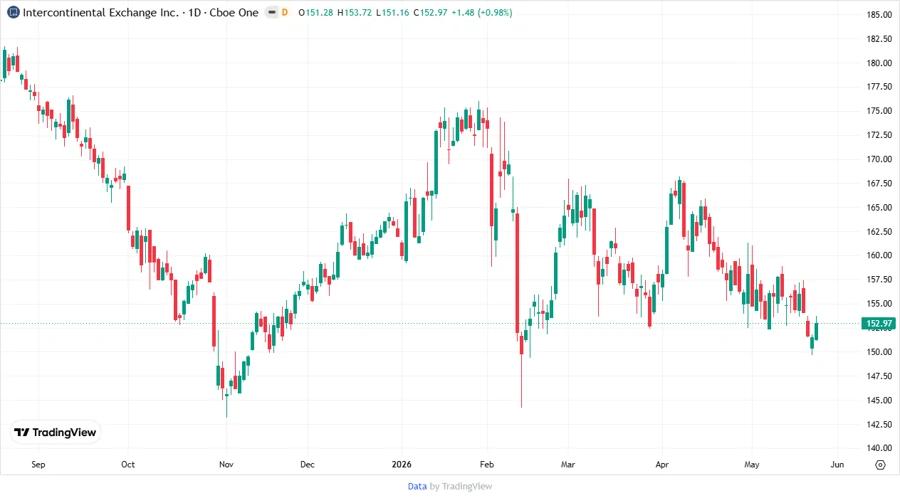
🌐 Price Development
🎯 Dividend Scoring System
| Criteria | Score | Bar |
|---|---|---|
| Dividend Yield | 3 | |
| Dividend Stability | 5 | |
| Dividend Growth | 4 | |
| Payout Ratio | 5 | |
| Financial Stability | 4 | |
| Dividend Continuity | 5 | |
| Cashflow Coverage | 4 | |
| Balance Sheet Quality | 5 |
Total Score: 35/40
⭐ Rating
Intercontinental Exchange, Inc. demonstrates exemplary financial and dividend metrics. With strong stability, growth, and cash flow coverage, it stands out as a prime candidate for dividend-focused portfolios.
Smart Data Insight
Master the Perfect Entry & Exit for this Stock
Don't leave your profits to chance. Historically, this stock follows specific seasonal patterns that institutional traders use to maximize returns.
- ✅ Identify the "Golden Buying Window"
- ✅ Avoid high-risk correction cycles
- ✅ Backtested data from the last 20+ years