February 11, 2026 a 03:31 pm
ICE: Dividend Analysis - Intercontinental Exchange, Inc.
Intercontinental Exchange, Inc., a major player in the financial services sector, demonstrates moderate dividend growth potential supported by its established history of dividend payments. The company exhibits stability with no recent dividend cuts or suspensions, reinforcing investor confidence despite its relatively modest dividend yield percentage.
📊 Overview
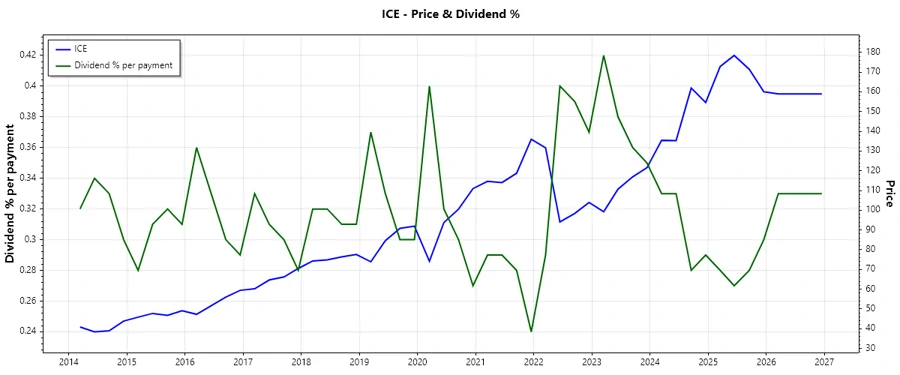
Intercontinental Exchange, Inc. operates within the financial sector, offering an attractive dividend yield of 1.26% supported by a steady dividend history over 14 years. The current dividend per share stands at $1.93 USD, with no recent cuts or suspensions, highlighting a commitment to maintaining shareholder returns.
| Metric | Value |
|---|---|
| Sector | Financial |
| Dividend Yield | 1.26 % |
| Current Dividend Per Share | 1.93 USD |
| Dividend History | 14 years |
| Last Cut or Suspension | None |
🗣️ Dividend History
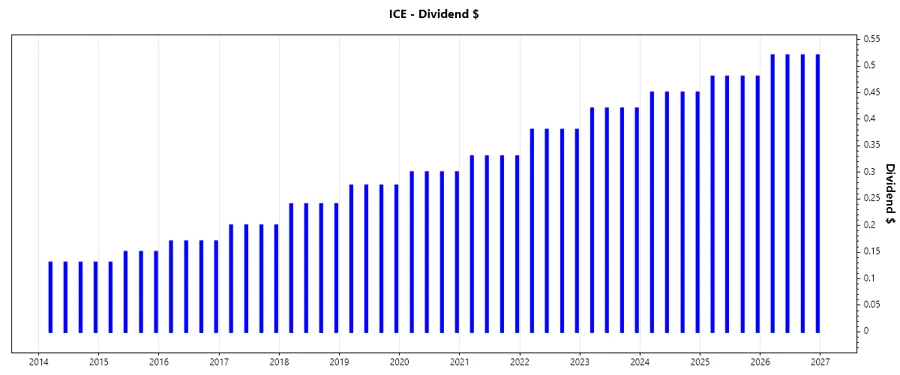
Analyzing a company’s dividend history provides insight into its ability to consistently reward shareholders. Intercontinental Exchange, Inc. has a rich timeline of dividend payments, indicating robust financial health and commitment to its investors.
| Year | Dividend Per Share (USD) |
|---|---|
| 2026 | 2.08 |
| 2025 | 1.92 |
| 2024 | 1.80 |
| 2023 | 1.68 |
| 2022 | 1.52 |
📈 Dividend Growth
Understanding dividend growth is essential for evaluating a company’s potential for increasing shareholder returns over time. Growth percentages reflect the company’s capability to enhance its dividends sustainably.
| Time | Growth |
|---|---|
| 3 years | 8.10 % |
| 5 years | 9.86 % |
The average dividend growth is 9.86% over 5 years. This shows moderate but steady dividend growth.
🖩 Payout Ratio
The payout ratio reflects a company’s ability to sustainably distribute dividends while maintaining sufficient earnings and cash flow. It is a critical metric for assessing financial health.
| Key Figure Ratio | Value |
|---|---|
| EPS-based | 33.44 % |
| Free cash flow-based | 25.72 % |
With an EPS payout ratio of 33.44% and a free cash flow payout ratio of 25.72%, Intercontinental Exchange, Inc. showcases solid earnings retention, indicating the ability to maintain or increase current dividend levels.
💵 Cashflow & Capital Efficiency
Analyzing cash flow and capital efficiency provides insights into a company’s operational effectiveness and capital allocation strategies, crucial for sustaining dividend payments and enhancing shareholder value.
| Metric | 2023 | 2024 | 2025 |
|---|---|---|---|
| Free Cash Flow Yield | 4.21% | 4.92% | 4.64% |
| Earnings Yield | 3.27% | 3.23% | 3.57% |
| CAPEX to Operating Cash Flow | 13.81% | 8.81% | 8.00% |
| Stock-based Compensation to Revenue | 2.60% | 1.96% | 1.88% |
| Free Cash Flow / Operating Cash Flow Ratio | 86.19% | 91.19% | 91.99% |
Intercontinental Exchange, Inc. illustrates robust capital efficiency, with consistent free cash flow yields and prudent CAPEX management, suggesting sustainable operations and potential for growth.
📊 Balance Sheet & Leverage Analysis
Evaluating the balance sheet and leverage metrics provides vital insights into a company’s financial stability and risk management capabilities, essential for long-term viability and dividend safety.
| Metric | 2023 | 2024 | 2025 |
|---|---|---|---|
| Debt-to-Equity | 0.89 | 0.75 | 0.70 |
| Debt-to-Assets | 0.17 | 0.15 | 0.15 |
| Debt-to-Capital | 0.47 | 0.43 | 0.41 |
| Net Debt to EBITDA | 4.48 | 3.27 | 2.92 |
| Current Ratio | 1.00 | 0.99 | 1.02 |
| Quick Ratio | 1.00 | 0.99 | 1.02 |
| Financial Leverage | 5.29 | 5.04 | 4.73 |
These indicators point to a gradual strengthening in leverage ratios, improving financial health, and stability, pivotal for supporting ongoing dividend commitments.
📈 Fundamental Strength & Profitability
Assessing a company’s fundamental strength through profitability and margin analyses identifies areas of competitive advantage and overall financial performance.
| Metric | 2023 | 2024 | 2025 |
|---|---|---|---|
| Return on Equity | 9.21% | 9.96% | 11.43% |
| Return on Assets | 1.74% | 1.98% | 2.41% |
| Net Profit Margin | 23.91% | 23.42% | 26.14% |
| EBIT Margin | 37.38% | 38.59% | 40.22% |
| EBITDA Margin | 49.65% | 51.65% | 52.56% |
| Gross Margin | 57.14% | 55.45% | 61.88% |
| Research & Development to Revenue | 0% | 0% | 0% |
Robust profitability margins and exceptional returns on equity and assets underscore Intercontinental Exchange, Inc.'s efficient use of resources, reinforcing its financial strength.
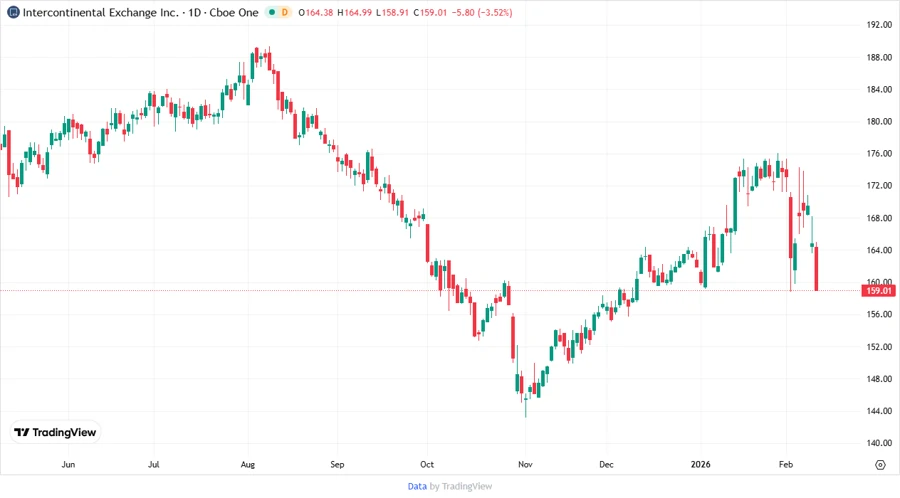
📉 Price Development
✅ Dividend Scoring System
| Criterion | Score | Score Bar |
|---|---|---|
| Dividend yield | 3 | |
| Dividend Stability | 5 | |
| Dividend growth | 4 | |
| Payout ratio | 5 | |
| Financial stability | 4 | |
| Dividend continuity | 5 | |
| Cashflow Coverage | 4 | |
| Balance Sheet Quality | 4 |
Total Score: 34/40
⚠️ Rating
Intercontinental Exchange, Inc. presents a solid investment profile with strong dividend metrics and financial health. It offers a compelling option for investors seeking steady income through dividends, supported by its robust payout ratios and financial stability. Nevertheless, with a modest dividend yield, investors should consider this as part of a broader income strategy.
Smart Data Insight
Master the Perfect Entry & Exit for this Stock
Don't leave your profits to chance. Historically, this stock follows specific seasonal patterns that institutional traders use to maximize returns.
- ✅ Identify the "Golden Buying Window"
- ✅ Avoid high-risk correction cycles
- ✅ Backtested data from the last 20+ years