January 23, 2026 a 03:31 am

ICE: Dividend Analysis - Intercontinental Exchange, Inc.
Intercontinental Exchange, Inc. (ICE) showcases a notable dividend profile within the financial services sector. With a steadily increasing dividend history and a respectable dividend yield, ICE stands out as a consistent performer in dividends. This analysis delves into the various aspects of ICE's dividend framework, reflecting on key metrics signifying the company's commitment to returning value to shareholders.
Overview 📊
| Metric | Details |
|---|---|
| Sector | Financial Services |
| Dividend Yield | 1.20% |
| Current Dividend Per Share | $1.81 USD |
| Dividend History | 13 years |
| Last Cut or Suspension | None |
Dividend History 🗣️
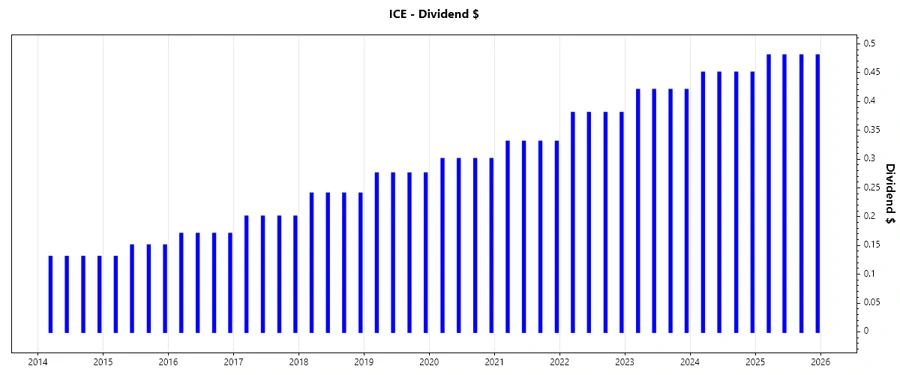
The dividend history of ICE, stretching over 13 years, demonstrates a robust commitment to increasing shareholder returns. This consistency is crucial for investors seeking reliable income streams from dividends, showcasing ICE's stability and growth-oriented strategy.
| Year | Dividend Per Share (USD) |
|---|---|
| 2025 | 1.92 |
| 2024 | 1.80 |
| 2023 | 1.68 |
| 2022 | 1.52 |
| 2021 | 1.32 |
Dividend Growth 📈
The dividend growth rate is indicative of ICE's capacity to enhance shareholder dividends aligned with company growth. Over the last 3 and 5 years, ICE has shown moderate yet consistent dividend increases, a positive indicator for long-term investors.
| Time | Growth |
|---|---|
| 3 years | 8.10% |
| 5 years | 9.86% |
The average dividend growth is 9.86% over 5 years. This shows moderate but steady dividend growth.
Payout Ratio 📉
Payout ratios are a vital metric that indicates the proportion of earnings distributed as dividends. ICE’s EPS-based payout ratio at 32.80% and FCF-based payout ratio at 23.54% reveal a conservative yet healthy approach, suggesting significant room for future dividend enhancements.
| Key Figure | Ratio |
|---|---|
| EPS-based | 32.80% |
| Free cash flow-based | 23.54% |
Both ratios indicate that ICE has a secure margin to increase dividends in the future without overextending its payout capabilities.
Cashflow & Capital Efficiency ✅
Analyzing cash flow metrics offers insights into the operational efficiency and sustainable financial health of ICE. Key figures like CAPEX to Operating Cash Flow and Free Cash Flow Yield illustrate ICE's capacity to generate free cash flow while maintaining strategic capital investments.
| Metric | 2022 | 2023 | 2024 |
|---|---|---|---|
| Free Cash Flow Yield | 5.36% | 4.21% | 4.93% |
| Earnings Yield | 2.52% | 3.27% | 3.23% |
| CAPEX to Operating Cash Flow | 13.56% | 13.81% | 8.81% |
| Stock-based Compensation to Revenue | 1.61% | 2.60% | 1.96% |
| Free Cash Flow / Operating Cash Flow Ratio | 86.44% | 86.19% | 91.19% |
ICE's ability to generate cash flow and efficiently allocate capital is evident. The cash flow stability and high capitalization ratios indicate a well-managed financial structure.
Balance Sheet & Leverage Analysis ⚠️
ICE's balance sheet ratios are indicative of its financial stability and leverage positioning. Metrics such as Debt-to-Equity provide insights into ICE's capital structure and risk levels associated with its debt obligations.
| Metric | 2022 | 2023 | 2024 |
|---|---|---|---|
| Debt-to-Equity | 80.93% | 89.09% | 74.88% |
| Debt-to-Assets | 9.46% | 16.84% | 14.85% |
| Debt-to-Capital | 44.73% | 47.12% | 42.82% |
| Net Debt to EBITDA | 4.80 | 4.48 | 3.27 |
| Current Ratio | 1.05 | 1.00 | 0.99 |
| Quick Ratio | 1.05 | 1.00 | 0.99 |
| Financial Leverage | 8.56 | 5.29 | 5.04 |
These ratios indicate an effectively managed balance sheet, showcasing a prudent approach towards leveraging, vital for maintaining financial flexibility.
Fundamental Strength & Profitability 📈
Assessing ICE's fundamental strength through profitability margins and returns on investment highlights the firm's capability to efficiently generate returns for shareholders. ICE's robust margin profiles underscore strong management and operational efficiency.
| Metric | 2022 | 2023 | 2024 |
|---|---|---|---|
| Return on Equity | 6.37% | 9.21% | 9.96% |
| Return on Assets | 0.74% | 1.74% | 1.98% |
| Net Margin | 15.01% | 23.91% | 23.41% |
| EBIT Margin | 25.16% | 37.38% | 38.59% |
| EBITDA Margin | 35.86% | 49.65% | 51.65% |
| Gross Margin | 53.99% | 57.14% | 55.45% |
| R&D to Revenue | 0% | 0% | 0% |
ICE’s profitability metrics reflect a strong capability to generate income from its business operations, ensuring continued shareholder value enhancement.
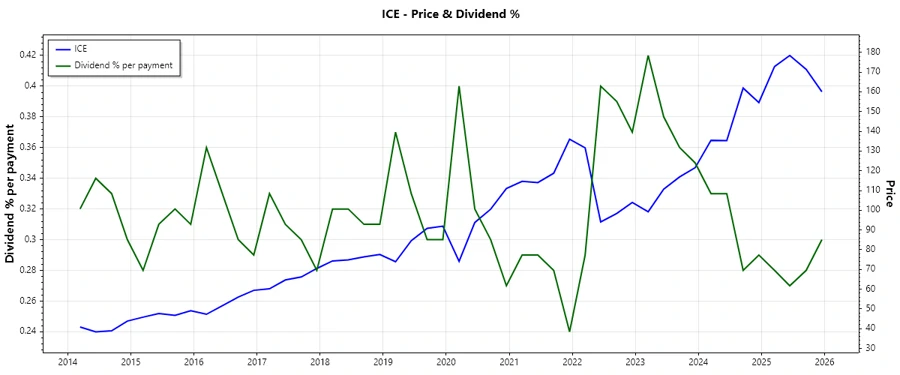
Price Development 📉
Dividend Scoring System 🗣️
| Criteria | Rating (1-5) | Score |
|---|---|---|
| Dividend Yield | 3 | |
| Dividend Stability | 5 | |
| Dividend Growth | 4 | |
| Payout Ratio | 5 | |
| Financial Stability | 4 | |
| Dividend Continuity | 5 | |
| Cashflow Coverage | 4 | |
| Balance Sheet Quality | 3 |
Total Score: 33/40
Rating ✅
Intercontinental Exchange, Inc. exhibits strong dividend fundamentals, underscored by steady growth and reliable payouts. It is recommended for investors who prioritize stable income with moderate growth potential, situating ICE as a solid, long-term dividend investment.