October 17, 2025 a 03:31 am


ICE: Dividend Analysis - Intercontinental Exchange, Inc.
Intercontinental Exchange, Inc. (ICE) demonstrates a strong dividend profile with consistent historic growth. The company has maintained a stable dividend payment history for over 13 years, reflecting financial robustness. Its current dividend yield is moderate, suggesting reliability and potential for income-oriented investors. The manageable payout ratio and steady revenue streams ensure sustainability, making ICE a compelling choice for long-term dividend investors. 📊
Overview 📈
In the financial landscape, Intercontinental Exchange, Inc. emerges as a robust entity within its sector, showcasing a sustainable and progressive approach to dividends. Its strategic positioning within the financial sector implies it capitalizes on global financial service demands.
| Characteristic | Value |
|---|---|
| Sector | Financials |
| Dividend Yield | 1.25% |
| Current Dividend Per Share | 1.81 USD |
| Dividend History | 13 years |
| Last Cut or Suspension | None |
Dividend History 📜
The historical dividend growth trajectory of ICE reveals a commitment to shareholder returns. Tracking the past decade's dividend payments highlights a steady increase, reflecting financial discipline and positive cash flow management.
| Year | Dividend Per Share (USD) |
|---|---|
| 2025 | 1.92 |
| 2024 | 1.80 |
| 2023 | 1.68 |
| 2022 | 1.52 |
| 2021 | 1.32 |
Dividend Growth 🚀
The visualized growth rates indicate ICE's strategic dividend increments over multiple periods. This stable growth is crucial for enhancing shareholder wealth and reflects the company's solid fiscal health.
| Time | Growth |
|---|---|
| 3 years | 10.89% |
| 5 years | 10.35% |
The average dividend growth is 10.35% over 5 years. This shows moderate but steady dividend growth.
Payout Ratio 💹
Analysing the payout ratios offers insights into ICE's dividend sustainability. The ratios signify how much revenue is allocated to dividends, a critical measure of financial prudence and long-term sustainability.
| Key Figure | Ratio |
|---|---|
| EPS-based | 34.60% |
| Free Cash Flow-based | 23.72% |
The EPS-based payout ratio at 34.60% and the FCF-based payout ratio at 23.72% indicate a responsible approach to dividend payouts, suggesting well-managed financial operations.
Cashflow & Capital Efficiency 💵
Robust cash flows and efficient capital handling are the cornerstones of ICE's financial strategy. Through strategic investments and sound operational cash flow management, ICE sustains its capital-intensive operations while ensuring adequate returns.
| Year | 2024 | 2023 | 2022 |
|---|---|---|---|
| Free Cash Flow Yield | 4.92% | 4.21% | 5.36% |
| Earnings Yield | 3.23% | 3.27% | 2.52% |
| CAPEX to Operating Cash Flow | 10.25% | 13.81% | 13.56% |
| Stock-based Compensation to Revenue | 1.96% | 2.60% | 1.61% |
| Free Cash Flow / Operating Cash Flow Ratio | 91.19% | 86.19% | 86.44% |
ICE maintains a strong focus on optimizing capital expenditure and maximizing free cash flow, indicating effectiveness in translating revenue into actual cash profit.
Balance Sheet & Leverage Analysis 📜
A keen assessment of financial leverage reveals ICE's risk management and debt level strategies. With a balanced approach to asset management, ICE ensures stable liquidity ratios while managing debt efficiently.
| Year | 2024 | 2023 | 2022 |
|---|---|---|---|
| Debt-to-Equity | 0.75 | 0.89 | 0.81 |
| Debt-to-Assets | 0.15 | 0.17 | 0.09 |
| Debt-to-Capital | 0.43 | 0.47 | 0.45 |
| Net Debt to EBITDA | 3.27 | 4.48 | 4.80 |
| Current Ratio | 1.00 | 1.00 | 1.05 |
| Quick Ratio | 0.99 | 1.00 | 1.05 |
| Financial Leverage | 5.04 | 5.29 | 8.56 |
ICE's strategic use of debt with moderate leverage ratios ensures both growth potential and risk mitigation, highlighting disciplined fiscal management.
Fundamental Strength & Profitability 🚦
The fundamental strength and profitability metrics indicate ICE's operational effectiveness and profit-generating capabilities essential for long-term value accretion.
| Year | 2024 | 2023 | 2022 |
|---|---|---|---|
| Return on Equity | 9.96% | 9.21% | 6.37% |
| Return on Assets | 1.98% | 1.74% | 0.74% |
| Margins: Net | 23.42% | 23.91% | 15.01% |
| EBIT | 38.59% | 37.38% | 25.16% |
| EBITDA | 51.65% | 49.65% | 35.86% |
| Gross | 55.45% | 57.14% | 53.99% |
| R&D to Revenue | 0% | 0% | 0% |
ICE's robust profit margins and returns reflect effective cost control and strategic resource allocation, ensuring continued operational profitability.
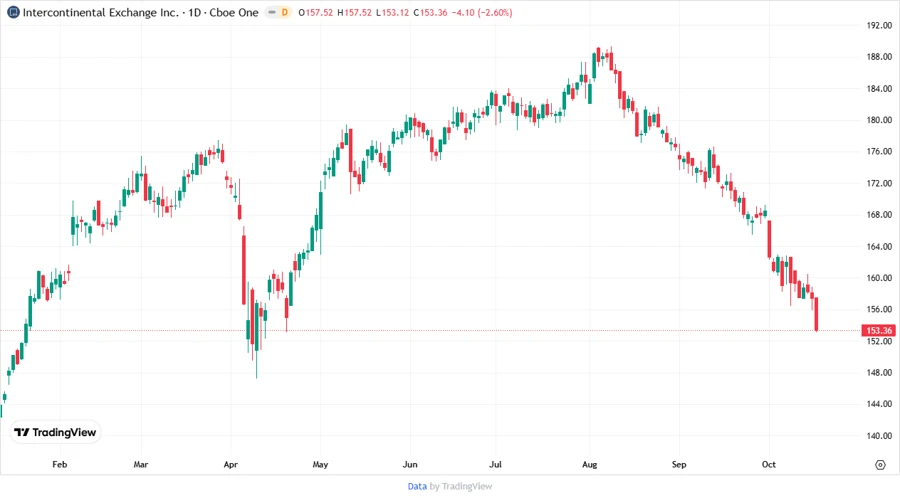
Price Development 📉
Dividend Scoring System 🎯
| Criteria | Score | Score Bar |
|---|---|---|
| Dividend yield | 3 / 5 | |
| Dividend Stability | 4 / 5 | |
| Dividend growth | 3 / 5 | |
| Payout ratio | 5 / 5 | |
| Financial stability | 4 / 5 | |
| Dividend continuity | 5 / 5 | |
| Cashflow Coverage | 4 / 5 | |
| Balance Sheet Quality | 4 / 5 |
Total Score: 32 / 40
Rating 🏆
Intercontinental Exchange, Inc. receives a strong recommendation as a dividend investment. With excellent payout strategies, robust financial stability, and consistent dividend growth, ICE fits well within a diversified income portfolio for long-term yields.
Smart Data Insight
Master the Perfect Entry & Exit for this Stock
Don't leave your profits to chance. Historically, this stock follows specific seasonal patterns that institutional traders use to maximize returns.
- ✅ Identify the "Golden Buying Window"
- ✅ Avoid high-risk correction cycles
- ✅ Backtested data from the last 20+ years