January 29, 2026 a 10:15 am

IBM: Fibonacci Analysis - International Business Machines Corporation
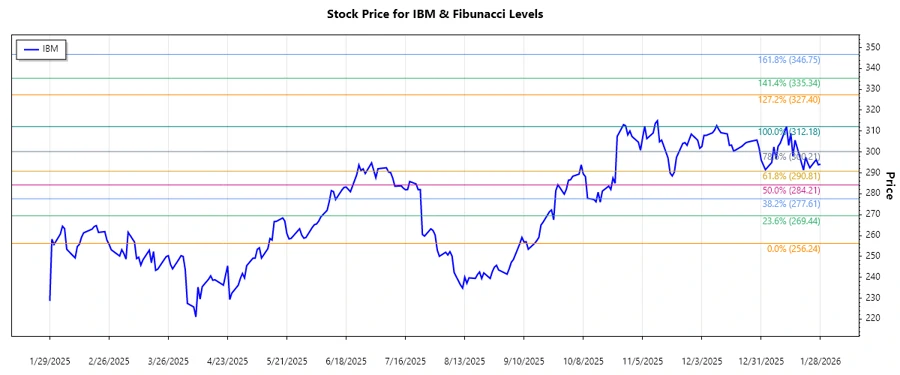
IBM has shown significant price movements over recent months, making it an intriguing subject for technical analysis. Recent price volatility reflects various macroeconomic and company-specific factors. By analyzing its price data with the Fibonacci retracement technique, we aim to identify potential support and resistance levels, providing insights that could impact future trading strategies.
Fibonacci Analysis
From the data analysis, IBM experienced a dominant upward trend in the latter part of the timeline. The trend started on September 15, 2025, at a low price of $256.24 and peaked on January 12, 2026, at a high price of $312.18. Based on these points, we calculate the following Fibonacci retracement levels:
| Level | Price |
|---|---|
| 0.236 | $296.39 |
| 0.382 | $285.48 |
| 0.5 | $284.21 |
| 0.618 | $282.94 |
| 0.786 | $278.27 |
As of the latest available price of $294.16, IBM's stock currently resides near the 0.236 retracement level. This positions the stock within a potential support zone, indicating that if the trend continues, it could rebound from this level.
Technically, this area could act as a strong support, suggesting a caution for traders expecting further declines. Conversely, a break below this level might signal a reversal or larger retracement.
Conclusion
IBM has recently shown an upward trend, with the potential for continued price appreciation if it holds above the 0.236 Fibonacci level. However, the market remains sensitive to global and company-specific news, which could affect its trajectory. Analysts should watch closely for any sustained breaks of key Fibonacci levels as they may dictate future price movements. While the trend appears positive, investors should consider the inherent risks and maintain a balanced approach.