April 13, 2025 a 09:15 am

IBM: Fibonacci Analysis - International Business Machines Corporation
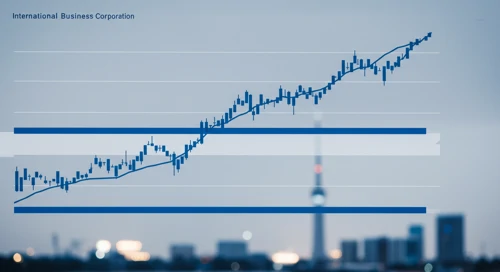
IBM has shown fluctuations in its market performance, reflecting both the innovative strides and challenges it faces in adapting to technological advancements and enterprise demands. The company's commitment to cloud solutions and AI might present substantial growth potential. However, competitive pressures and economic uncertainties could pose risks. The stock's technical setup indicates important support and resistance levels that investors are keenly observing.
Fibonacci Analysis
| Aspect | Detail | ||||||||||||
|---|---|---|---|---|---|---|---|---|---|---|---|---|---|
| Trend Start Date | 2025-02-20 | ||||||||||||
| Trend End Date | 2025-04-11 | ||||||||||||
| Highest Price | $264.74 on 2025-02-20 | ||||||||||||
| Lowest Price | $217.75 on 2024-11-14 | ||||||||||||
| Fibonacci Levels |
|
||||||||||||
| Current Price | $235.48 | ||||||||||||
| Current Zone | 0.236 - Currently observing a retracement around the 0.236 level. | ||||||||||||
| Interpretation | The retracement near the 0.236 level suggests potential support. A hold above this zone could indicate readiness for a bounceback. |
Conclusion
IBM’s current retracement near the 0.236 Fibonacci level points toward possible stabilization and support. Should the price uphold above this level, it may embolden investors and traders to anticipate a potential upward move. Conversely, a break below this could signal further consolidation or a deeper correction. Balancing its cloud capabilities with market competitiveness is crucial for IBM. While there are substantial opportunities driven by tech innovation, the risks from broader economic factors mean that investors must stay vigilant and flexible in their strategies.