March 07, 2026 a 03:31 am


IBM: Dividend Analysis - International Business Machines Corporation
As a seasoned participant in the technology sphere, IBM continues to uphold its reputation as a reliable dividend-paying corporation. With a consistent dividend history spanning 57 years, it exemplifies stability and commitment to shareholder returns. Despite a relatively modest dividend yield of 2.30%, IBM's long-standing reliability and incremental dividend growth represent a solid choice in a diversified portfolio, particularly for stakeholders valuing consistent income over rapid growth.
📊 Overview
IBM operates within the Technology sector, renowned for its sustainable dividend scheme. Here is a snapshot of its key dividend metrics:
| Sector | Dividend yield | Current dividend per share | Dividend history | Last cut or suspension |
|---|---|---|---|---|
| Technology | 2.30 % | 6.71 USD | 57 years | None |
🗣️ Dividend History
IBM's dividend history is a testament to its resilient financial strategy, managing to increase dividend payouts over the decades. A stable dividend history is a pivotal indicator of corporate reliability and shareholder dedication.
| Year | Dividend per Share (USD) |
|---|---|
| 2026 | 1.68 |
| 2025 | 6.71 |
| 2024 | 6.67 |
| 2023 | 6.63 |
| 2022 | 6.59 |
📈 Dividend Growth
Understanding dividend growth is crucial in evaluating future income potential. IBM shows moderate dividend growth over the past years, reflecting its balanced approach between reinvestments and shareholder returns.
| Time | Growth |
|---|---|
| 3 years | 0.60 % |
| 5 years | 1.52 % |
The average dividend growth is 1.52% over 5 years. This shows moderate but steady dividend growth.
📉 Payout Ratio
The payout ratio is a pivotal financial metric that evaluates how much of a company's earnings are paid out as dividends to shareholders. It provides a glimpse into the sustainability of current dividend policies.
| Key figure | Ratio |
|---|---|
| EPS-based | 59.31% |
| Free cash flow-based | 51.23% |
With an EPS-based payout ratio of 59.31% and a FCF-based ratio of 51.23%, IBM maintains a balanced payout scheme that supports its dividend sustainability while retaining capital for growth opportunities.
✅ Cashflow & Capital Efficiency
Cash flow stability and efficient use of capital are cornerstones of IBM’s operational strategy, ensuring financial flexibility and capacity to fund innovations and shareholder returns alike.
| Year | 2025 | 2024 | 2023 |
|---|---|---|---|
| Free Cash Flow Yield | 4.19% | 5.71% | 8.13% |
| Earnings Yield | 3.84% | 2.92% | 5.03% |
| CAPEX to Operating Cash Flow | 12.26% | 12.53% | 12.99% |
| Stock-based Compensation to Revenue | 0% | 2.09% | 1.83% |
| Free Cash Flow / Operating Cash Flow Ratio | 87.74% | 87.47% | 87.01% |
IBM's free cash flow yield, reflective of its operational efficiency, correlates positively with its ability to comfortably meet short-term obligations while reinvesting in future growth paths.
⚠️ Balance Sheet & Leverage Analysis
IBM's leverage analysis substantiates its strategic financial management. Regular evaluation of leverage metrics guarantees robust financial health and capital structure.
| Year | 2025 | 2024 | 2023 |
|---|---|---|---|
| Debt-to-Equity | 2.06 | 2.14 | 2.66 |
| Debt-to-Assets | 44.22% | 42.57% | 44.32% |
| Debt-to-Capital | 67.29% | 68.14% | 72.68% |
| Net Debt to EBITDA | 3.10 | 3.65 | 3.19 |
| Current Ratio | 0.93 | 1.00 | 0.93 |
| Quick Ratio | 0.90 | 1.00 | 0.93 |
| Financial Leverage | 4.65 | 5.02 | 6.00 |
IBM's leverage positions indicate a high utilization of debt, necessitating vigilant management to avert compromising financial stability while harnessing growth financing opportunities.
⭐ Fundamental Strength & Profitability
Evaluating IBM's fundamental strength implicates its core operational health and profitability viability, with a focus on margins and return metrics.
| Year | 2025 | 2024 | 2023 |
|---|---|---|---|
| Return on Equity | 32.45% | 22.06% | 33.29% |
| Return on Assets | 6.97% | 4.39% | 5.55% |
| Margins: Net | 15.69% | 9.60% | 12.13% |
| EBIT Margin | 18.16% | 11.97% | 16.65% |
| EBITDA Margin | 25.59% | 19.40% | 23.75% |
| Gross Margin | 59.50% | 56.65% | 55.45% |
| Research & Development to Revenue | 12.32% | 11.92% | 10.95% |
IBM's profitability metrics underscore its solid foundational operations, strategically allocating resources to sustain competitive advantages through innovation and market adaptation.
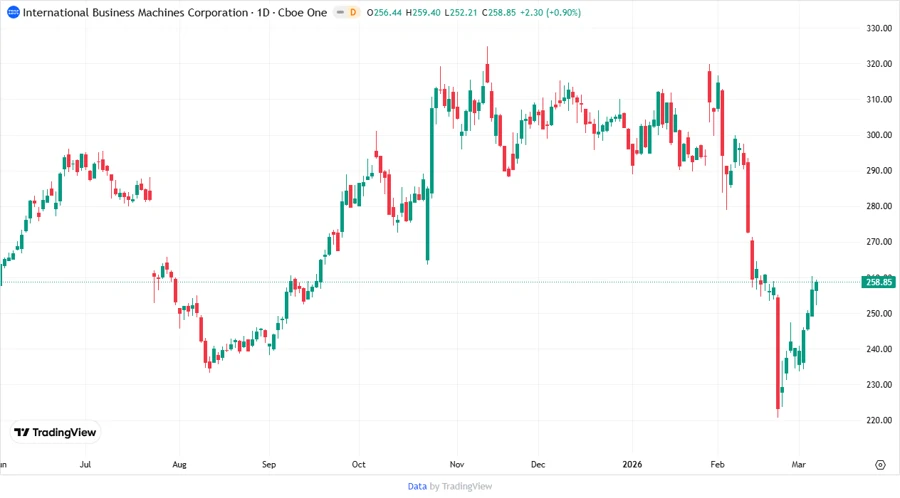
📊 Price Development
💯 Dividend Scoring System
| Category | Score | Score Bar |
|---|---|---|
| Dividend Yield | 3 | |
| Dividend Stability | 5 | |
| Dividend Growth | 3 | |
| Payout Ratio | 4 | |
| Financial Stability | 4 | |
| Dividend Continuity | 5 | |
| Cashflow Coverage | 4 | |
| Balance Sheet Quality | 3 |
Total Score: 31/40
🗒️ Rating
IBM's dividend profile portrays it as a dependable income-generating avenue. Offering solid dividend stability and moderate growth, enveloped by financial prudence and market adaptability, it is best suited for investors prioritizing steady returns through strategic equity exposure in technology.
Smart Data Insight
Master the Perfect Entry & Exit for this Stock
Don't leave your profits to chance. Historically, this stock follows specific seasonal patterns that institutional traders use to maximize returns.
- ✅ Identify the "Golden Buying Window"
- ✅ Avoid high-risk correction cycles
- ✅ Backtested data from the last 20+ years