September 10, 2025 a 11:32 am

IBM: Dividend Analysis - International Business Machines Corporation
IBM, a stalwart in the technology sector, presents an intriguing case for dividend investors. It boasts a robust dividend history with 56 consecutive years of payouts, reflecting its financial resilience. Despite facing challenges, IBM's focus on innovation and strategic acquisitions highlights its adaptability in the ever-evolving tech landscape.
📊 Overview
IBM operates in the Technology sector, with a current dividend yield of 2.77% and a dividend per share of 6.56 USD. The company has an impressive dividend history spanning 56 years. The absence of recent cuts or suspensions further underscores its commitment to maintaining shareholder returns.
| Key Metrics | Value |
|---|---|
| Sector | Technology |
| Dividend Yield | 2.77% |
| Current Dividend per Share | 6.56 USD |
| Dividend History | 56 years |
| Last Cut or Suspension | None |
🗣️ Dividend History
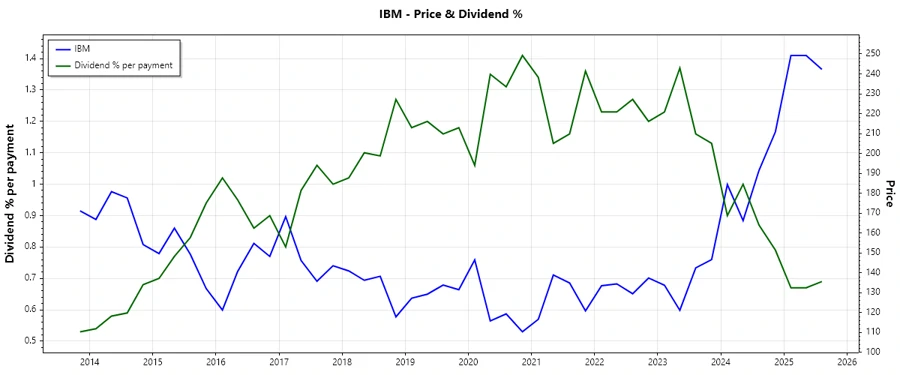
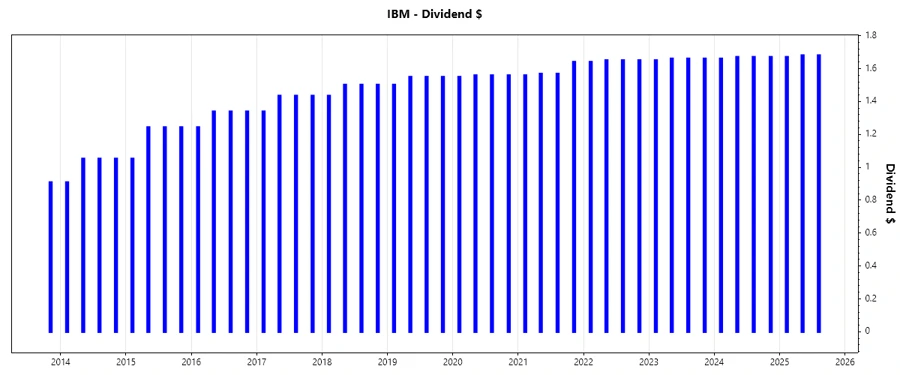
IBM's extensive dividend history spans over half a century. This track record is crucial as it demonstrates the company's steadfast dedication to returning capital to shareholders, even amidst market volatility. Stability in dividends can be a strong indicator of company health and reliability.
| Year | Dividend per Share (USD) |
|---|---|
| 2025 | 5.03 |
| 2024 | 6.67 |
| 2023 | 6.63 |
| 2022 | 6.59 |
| 2021 | 6.33 |
📈 Dividend Growth
Dividend growth is a critical factor that investors monitor to assess the potential for increased income over time. IBM's recent dividend growth over 3 and 5 years shows steady, albeit moderate, advancement, highlighting its ability to generate sustainable cash flows and confidence in future earnings.
| Time | Growth |
|---|---|
| 3 years | 1.74% |
| 5 years | 1.65% |
The average dividend growth is 1.65% over 5 years. This shows moderate but steady dividend growth.
✅ Payout Ratio
Payout ratios indicate the proportion of earnings distributed as dividends. An EPS payout ratio exceeding 100% suggests dividends exceed earnings, potentially unsustainable long-term. A prudent FCF payout ratio below 52% indicates a healthier cash flow alignment, crucial for ongoing dividend stability.
| Key Figure Ratio | Value |
|---|---|
| EPS-based | 104.51% |
| Free Cash Flow-based | 51.74% |
The EPS payout ratio of 104.51% raises concerns about sustainability, while the FCF payout ratio at 51.74% depicts a balanced approach, aligning dividends with cash flow capabilities.
💼 Cashflow & Capital Efficiency
Cash flow efficiency and capital allocation are critical for maintaining both operational flexibility and strategic growth. Metrics like free cash flow yield and the evaluation of CAPEX relative to operating cash flow indicate how adeptly IBM manages its resources.
| Metrics | 2024 | 2023 | 2022 |
|---|---|---|---|
| Free Cash Flow Yield | 5.71% | 8.13% | 6.65% |
| Earnings Yield | 2.92% | 5.03% | 1.29% |
| CAPEX to Operating Cash Flow | 12.53% | 12.99% | 18.90% |
| Stock-based Compensation to Revenue | 2.09% | 1.83% | 1.63% |
| Free Cash Flow / Operating Cash Flow Ratio | 87.47% | 87.01% | 81.10% |
IBM demonstrates consistent cash flow efficiency, supporting financial stability and ensuring ongoing capital investment capabilities through its calculated economic strategies.
📉 Balance Sheet & Leverage Analysis
A solid balance sheet and appropriate leverage levels are indicative of financial vigor and risk mitigation. The ratios presented here highlight IBM's approach to debt management and capability to meet financial obligations.
| Metrics | 2024 | 2023 | 2022 |
|---|---|---|---|
| Debt-to-Equity | 2.14 | 2.66 | 2.46 |
| Debt-to-Assets | 0.43 | 0.44 | 0.42 |
| Debt-to-Capital | 0.68 | 0.73 | 0.71 |
| Net Debt to EBITDA | 3.65 | 3.19 | 6.43 |
| Current Ratio | N/A | N/A | N/A |
| Quick Ratio | 1.00 | 0.93 | 0.87 |
| Financial Leverage | 5.02 | 6.00 | 5.80 |
The measures reflect IBM's heightened focus on managing leverage strategically to ensure operational stability and flexible financial positioning amidst shifting market conditions.
💪 Fundamental Strength & Profitability
Evaluating IBM's fundamental strength through profitability metrics like ROE, ROA, and various margins, provides insight into operational efficiency and the potential for sustained growth.
| Metrics | 2024 | 2023 | 2022 |
|---|---|---|---|
| Return on Equity | 22.06% | 33.29% | 7.47% |
| Return on Assets | 4.39% | 5.55% | 1.29% |
| Net Profit Margin | 9.60% | 12.13% | 2.71% |
| EBIT Margin | 11.97% | 16.65% | 3.92% |
| EBITDA Margin | 19.40% | 23.75% | 11.85% |
| Gross Margin | 56.65% | 55.45% | 54.00% |
| R&D to Revenue | 11.92% | 10.95% | 10.85% |
The impressive margins and returns present IBM as a fundamentally robust enterprise, capable of leveraging internal efficiencies and strategic investment in R&D for sustained innovation and profitability.
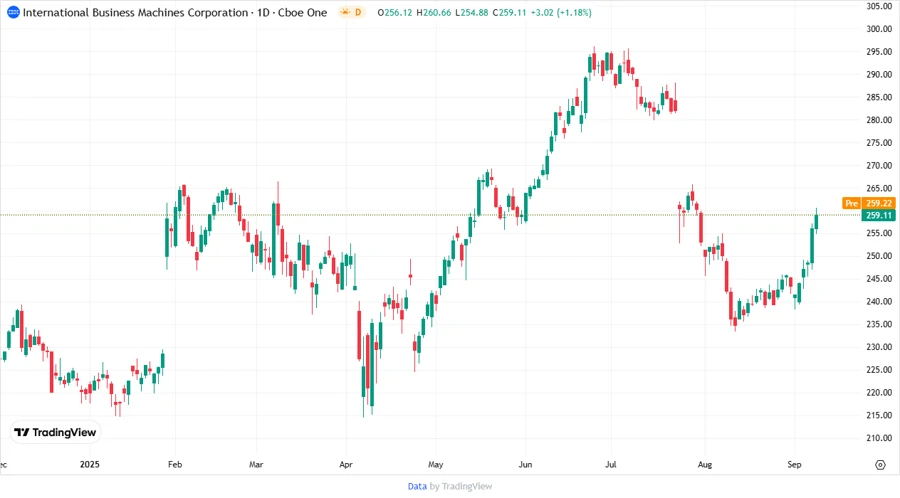
📈 Price Development
🔍 Dividend Scoring System
| Category | Score | Visual Representation |
|---|---|---|
| Dividend Yield | 3 | |
| Dividend Stability | 5 | |
| Dividend Growth | 2 | |
| Payout Ratio | 2 | |
| Financial Stability | 4 | |
| Dividend Continuity | 5 | |
| Cashflow Coverage | 4 | |
| Balance Sheet Quality | 3 |
Overall Score: 28/40
🏆 Rating
IBM represents a robust investment opportunity with a mature dividend profile. Despite some concerns surrounding payout ratios and modest dividend growth, its longstanding history of dividend reliability adds to investor confidence. Tailored strategies aimed at increasing revenue streams further solidify its investment potential in a balanced portfolio.
Smart Data Insight
Master the Perfect Entry & Exit for this Stock
Don't leave your profits to chance. Historically, this stock follows specific seasonal patterns that institutional traders use to maximize returns.
- ✅ Identify the "Golden Buying Window"
- ✅ Avoid high-risk correction cycles
- ✅ Backtested data from the last 20+ years