August 24, 2025 a 11:32 am

IBM: Dividend Analysis - International Business Machines Corporation
IBM has been a cornerstone in technology for decades, offering a strong dividend yield with over half a century of history. The company has demonstrated resilience through consistent dividend payments, making it an attractive option for income-focused investors. However, potential investors should be aware of its high payout ratio and assess its long-term sustainability.
📊 Overview
IBM operates in the technology sector, providing comprehensive solutions from hardware to software and services. The current dividend yield stands at 2.77%, reflecting a solid historical history of 56 years without any cuts or suspensions. The current dividend payment is $6.56 per share.
| Detail | Value |
|---|---|
| Sector | Technology |
| Dividend Yield | 2.77% |
| Current Dividend per Share | $6.56 |
| Dividend History | 56 years |
| Last Cut or Suspension | None |
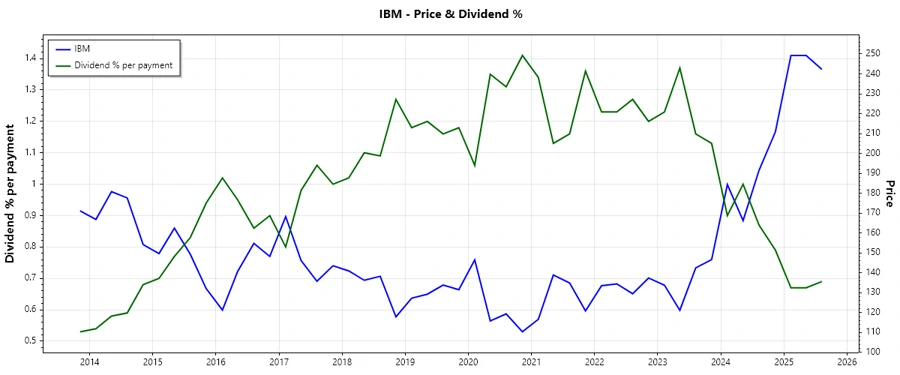
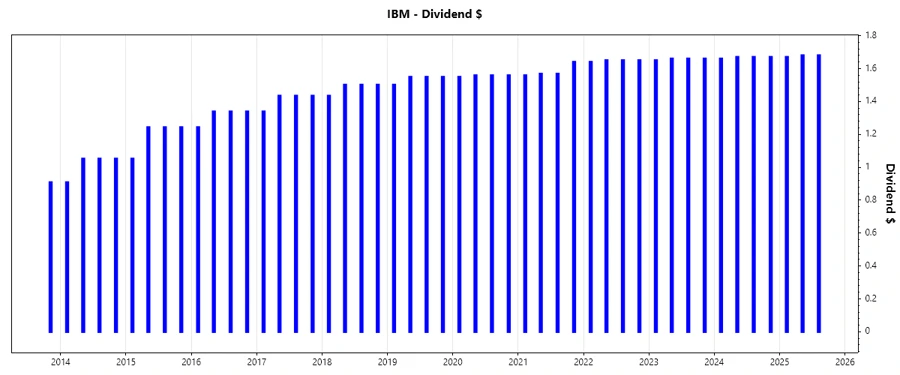
📉 Dividend History
IBM's long-standing history of dividend payments highlights its commitment to returning capital to shareholders. This consistency is a positive indicator of financial health, attracting long-term investors. However, monitoring dividend adjustments is essential to ascertain ongoing viability.
| Year | Dividend per Share (USD) |
|---|---|
| 2025 | 5.03 |
| 2024 | 6.67 |
| 2023 | 6.63 |
| 2022 | 6.59 |
| 2021 | 6.33 |
📈 Dividend Growth
Dividend growth is indicative of a company's capacity to generate higher earnings over time. IBM's annualized growth of 1.74% over three years and 1.65% over five years exhibits moderate but steady increments, signifying resilience in its financial strategizing.
| Time | Growth |
|---|---|
| 3 years | 1.74% |
| 5 years | 1.65% |
The average dividend growth is 1.65% over 5 years. This shows moderate but steady dividend growth.
✅ Payout Ratio
Analyzing the payout ratio provides insights into the sustainability of a company’s dividend payments. IBM's EPS-based payout is relatively high at 104.51%, suggesting potential stress on earnings to support dividends. The ratio based on free cash flow is more manageable at 51.74%.
| Key Figure | Ratio |
|---|---|
| EPS-based | 104.51% |
| Free Cash Flow-based | 51.74% |
The EPS payout ratio is concerning as it surpasses 100%, indicating that IBM might be using more than its earnings capacity for dividends which could impact its financial stability.
Cashflow & Capital Efficiency
Assessing cash flows along with capital efficiency ratios furnishes a narrative on the company's operational robustness and strategic capital allocation. IBM shows a respectable Free Cash Flow Yield of 5.24% and a Free Cash Flow to Operating Cash Flow Ratio of 87.47%, underlining effective cash management.
| Year | 2024 | 2023 | 2022 |
|---|---|---|---|
| Free Cash Flow Yield | 5.71% | 8.13% | 6.65% |
| Earnings Yield | 2.92% | 5.03% | 1.29% |
| CAPEX to Operating Cash Flow | 12.53% | 12.99% | 18.90% |
| Stock-based Compensation to Revenue | 2.09% | 1.83% | 1.63% |
| Free Cash Flow / Operating Cash Flow Ratio | 87.47% | 87.01% | 81.10% |
The data indicates prudent financial management with high capital efficiency, vital for long-term growth and sustaining dividend payouts.
Balance Sheet & Leverage Analysis
Understanding leverage and overall balance sheet health is crucial for assessing a company’s potential risk and financial flexibility. IBM's Debt-to-Equity Ratio is substantially high at over 2, although it balances leverage with a manageable current ratio close to 1 in recent years.
| Year | 2024 | 2023 | 2022 |
|---|---|---|---|
| Debt-to-Equity | 2.14 | 2.66 | 2.46 |
| Debt-to-Assets | 42.57% | 44.32% | 42.45% |
| Debt-to-Capital | 68.14% | 72.68% | 71.11% |
| Net Debt to EBITDA | 3.65 | 3.19 | 6.43 |
| Current Ratio | 1.04 | 0.96 | 0.92 |
| Quick Ratio | 1.00 | 0.93 | 0.87 |
| Financial Leverage | 5.02 | 6.00 | 5.80 |
IBM's balance sheet emphasizes capital structure management but indicates a cautious approach warranted by high leverage ratios.
Fundamental Strength & Profitability
Profitability metrics are instrumental in appraising company performance. IBM exhibits impressive margins with a rebound in ROE to above 22% from historical lows, signifying an enhanced operational strategy focused on profitability.
| Year | 2024 | 2023 | 2022 |
|---|---|---|---|
| Return on Equity | 22.06% | 33.29% | 7.47% |
| Return on Assets | 4.39% | 5.55% | 1.29% |
| Margins: Net | 9.60% | 12.13% | 2.71% |
| EBIT | 11.97% | 16.65% | 3.91% |
| EBITDA | 19.40% | 23.75% | 11.85% |
| Gross | 56.65% | 55.45% | 54.00% |
| Research & Development to Revenue | 11.92% | 10.95% | 10.85% |
The data highlights overall positive trends, indicating strong management strategies, but underscores areas for future focus in R&D investments.
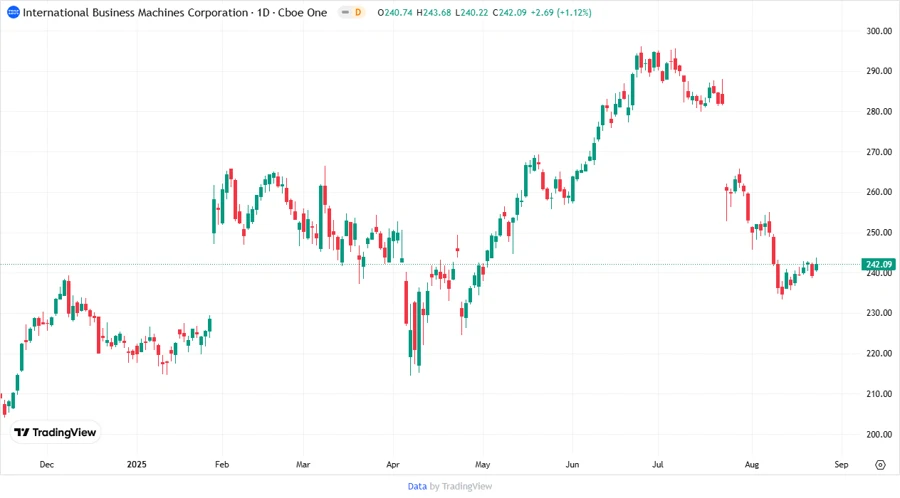
Price Development
📏 Dividend Scoring System
Evaluating IBM’s dividend offering through this scoring system helps identify its performance across various dividend-related metrics.
| Category | Score / 5 | Score Bar |
|---|---|---|
| Dividend Yield | 3 | |
| Dividend Stability | 5 | |
| Dividend Growth | 2 | |
| Payout Ratio | 2 | |
| Financial Stability | 3 | |
| Dividend Continuity | 5 | |
| Cashflow Coverage | 4 | |
| Balance Sheet Quality | 3 |
Total Score: 27/40
🗣️ Rating
IBM stands as a reliable candidate for conservative income investors, binding its future with consistent dividend trends and robust cash flow management. However, its elevated payout ratio and debt levels invite cautious optimism. Investors are advised to keep an eye on its ongoing financial strategies and cash flow stability to ensure consistent dividends.
Smart Data Insight
Master the Perfect Entry & Exit for this Stock
Don't leave your profits to chance. Historically, this stock follows specific seasonal patterns that institutional traders use to maximize returns.
- ✅ Identify the "Golden Buying Window"
- ✅ Avoid high-risk correction cycles
- ✅ Backtested data from the last 20+ years