August 16, 2025 a 02:47 am

IBM: Dividend Analysis - International Business Machines Corporation
International Business Machines Corporation (IBM) exhibits a robust dividend profile with a consistent history of payments. As a leader in its industry, IBM offers a moderate dividend yield backed by a sustained record of increments, making it attractive to income-focused investors. Their dividend growth, while steady, reflects disciplined capital allocation. However, the payout ratio, especially on an EPS basis, suggests a need for cautious evaluation. Investors should balance dividend appeal with overall financial sustainability.
📊 Overview
IBM operates in the technology sector, offering a compelling dividend yield of 2.77%, with a current dividend per share set at $6.56 USD. The company boasts a strong dividend history, maintaining dividend payments for 56 years, with no recent cuts or suspensions. This demonstrates IBM's commitment to returning value to shareholders.
| Metric | Details |
|---|---|
| Sector | Technology |
| Dividend Yield | 2.77 % |
| Current Dividend per Share | 6.56 USD |
| Dividend History | 56 years |
| Last Cut or Suspension | None |
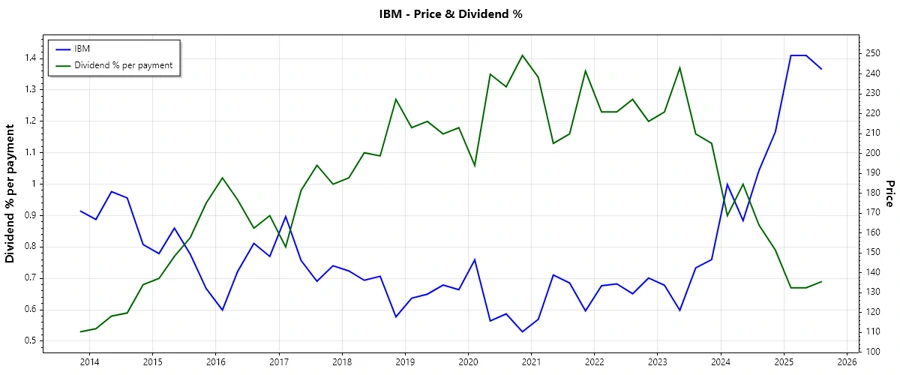
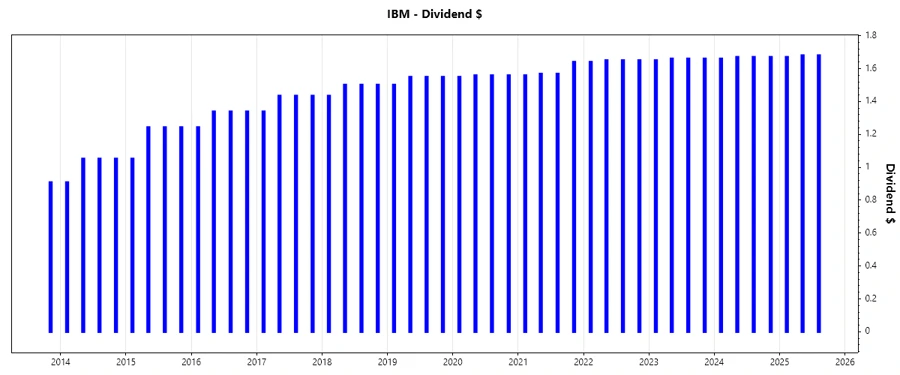
🗣️ Dividend History
IBM's long-standing tradition of dividend payouts showcases its resilience and dedication towards rewarding its shareholders. Understanding this history is crucial for predicting future performance and financial health.
| Year | Dividend per Share (USD) |
|---|---|
| 2025 | 5.03 |
| 2024 | 6.67 |
| 2023 | 6.63 |
| 2022 | 6.59 |
| 2021 | 6.33 |
📈 Dividend Growth
Evaluating IBM's dividend growth is essential for assessing its long-term sustainability and attractiveness to investors. Recent years show a modest increase in dividends, indicating stability.
| Time | Growth |
|---|---|
| 3 years | 1.74 % |
| 5 years | 1.65 % |
The average dividend growth is 1.65% over 5 years. This shows moderate but steady dividend growth.
📉 Payout Ratio
The payout ratio indicates how much of its earnings a company is distributing as dividends. IBM's ratios suggest a heavy dependency on Free Cash Flow rather than earnings, which is a sign of prudent financial management.
| Key Figure | Ratio |
|---|---|
| EPS-based | 104.51 % |
| Free cash flow-based | 51.74 % |
The EPS payout ratio of 104.51% is concerning as it shows dividends exceed earnings, however, the FCF payout ratio of 51.74% indicates dividends are well-covered by cash flows, reflecting cautious financial strategy.
✅ Cashflow & Capital Efficiency
Assessing cash flow allows for understanding the operational efficiency of a company. Strong cash generation provides confidence in continued dividend payments.
| Metric | 2024 | 2023 | 2022 |
|---|---|---|---|
| Free Cash Flow Yield | 5.71% | 8.13% | 6.65% |
| Earnings Yield | 2.92% | 5.03% | 1.29% |
| CAPEX to Operating Cash Flow | 12.53% | 12.99% | 18.89% |
| Stock-based Compensation to Revenue | 2.09% | 1.83% | 1.63% |
| Free Cash Flow / Operating Cash Flow Ratio | 87.47% | 87.01% | 81.10% |
The cash flow and efficiency metrics reflect IBM's strong cash flow management and operational efficiency, crucial for sustaining future dividends and capital expenditures.
🗣️ Balance Sheet & Leverage Analysis
Understanding leverage and balance sheet strength is paramount to evaluating IBM's financial flexibility and risk profile.
| Metric | 2024 | 2023 | 2022 |
|---|---|---|---|
| Debt-to-Equity | 2.14 | 2.66 | 2.46 |
| Debt-to-Assets | 0.43 | 0.44 | 0.42 |
| Debt-to-Capital | 0.68 | 0.73 | 0.71 |
| Net Debt to EBITDA | 3.65 | 3.19 | 6.43 |
| Current Ratio | 1.04 | 0.96 | 0.92 |
| Quick Ratio | 1.00 | 0.93 | 0.87 |
The balance sheet ratios highlight potential concerns with the relatively high debt load; however, these are mitigated by strong EBITDA coverage, suggesting adequate leverage management.
📈 Fundamental Strength & Profitability
Profitability metrics are essential for evaluating IBM's ability to generate earnings relative to sales, assets, and equity, indicating operational efficiency.
| Metric | 2024 | 2023 | 2022 |
|---|---|---|---|
| Return on Equity | 22.06% | 33.29% | 7.47% |
| Return on Assets | 4.39% | 5.55% | 1.29% |
| Net Margin | 9.60% | 12.13% | 2.71% |
IBM's recent profitability improvements demonstrate its capability to efficiently convert sales into profits, underpinning future dividend safety.
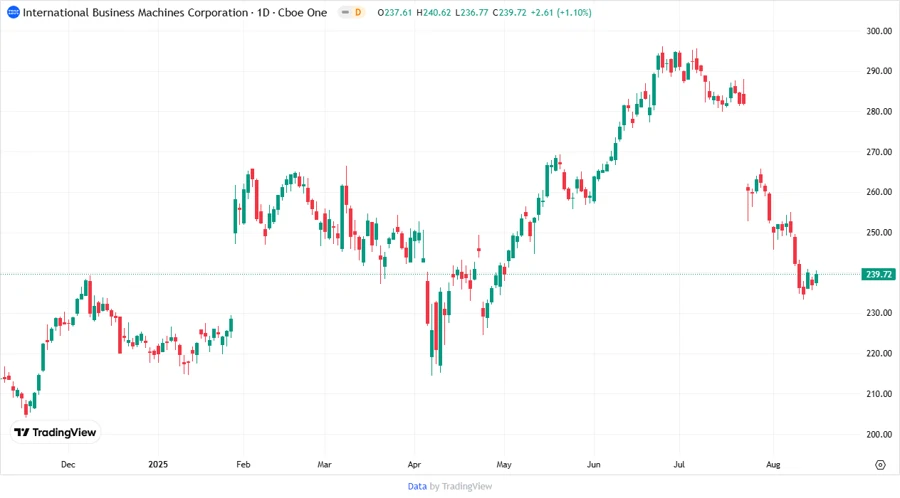
Price Development
✅ Dividend Scoring System
| Criterion | Score | Visualization |
|---|---|---|
| Dividend Yield | 4/5 | |
| Dividend Stability | 5/5 | |
| Dividend Growth | 3/5 | |
| Payout Ratio | 2/5 | |
| Financial Stability | 3/5 | |
| Dividend Continuity | 5/5 | |
| Cashflow Coverage | 4/5 | |
| Balance Sheet Quality | 3/5 |
Overall Score: 29/40
📈 Rating
IBM demonstrates a strong dividend track record with respectable yield and stability, although some caution is warranted due to a high EPS payout ratio. With prudent cash management and consistent profitability, IBM offers a compelling dividend opportunity for income-focused investors, despite leverage concerns. Thus, IBM is recommended for those seeking reliable income with potential appreciation upside.
Smart Data Insight
Master the Perfect Entry & Exit for this Stock
Don't leave your profits to chance. Historically, this stock follows specific seasonal patterns that institutional traders use to maximize returns.
- ✅ Identify the "Golden Buying Window"
- ✅ Avoid high-risk correction cycles
- ✅ Backtested data from the last 20+ years