
May 27, 2026 a 03:15 am
IBKR: Trend and Support & Resistance Analysis - Interactive Brokers Group, Inc.
Interactive Brokers Group, Inc. operates as an automated electronic broker with expansive operations across numerous financial instruments. The stock has shown significant activity over the analyzed period, with evident trend fluctuations highlighted by both bullish and bearish phases. The current technical indicators and price levels suggest potential strategic decisions for investors seeking opportunities in the brokerage sector.
Trend Analysis
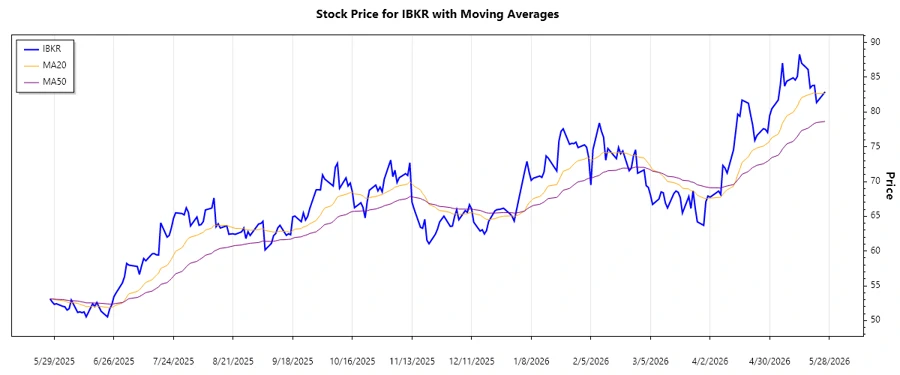
The analysis of Interactive Brokers Group, Inc. stock over the recent period reveals a complex interplay of market forces. Extensive calculations of the EMA20 and EMA50 indicate a shifting trend pattern toward the latter part of the dataset.
| Date | Close Price | Trend |
|---|---|---|
| 2026-05-26 | $82.89 | ▲ Uptrend |
| 2026-05-22 | $81.35 | ▲ Uptrend |
| 2026-05-21 | $83.83 | ▲ Uptrend |
| 2026-05-20 | $83.79 | ▲ Uptrend |
| 2026-05-19 | $83.45 | ▲ Uptrend |
| 2026-05-18 | $86.12 | ▲ Uptrend |
| 2026-05-15 | $87.00 | ▲ Uptrend |
The trend appears to be on an uptrend as evidenced by the EMA20 crossing above the EMA50, signifying possible bullish sentiment in the market.
Support and Resistance
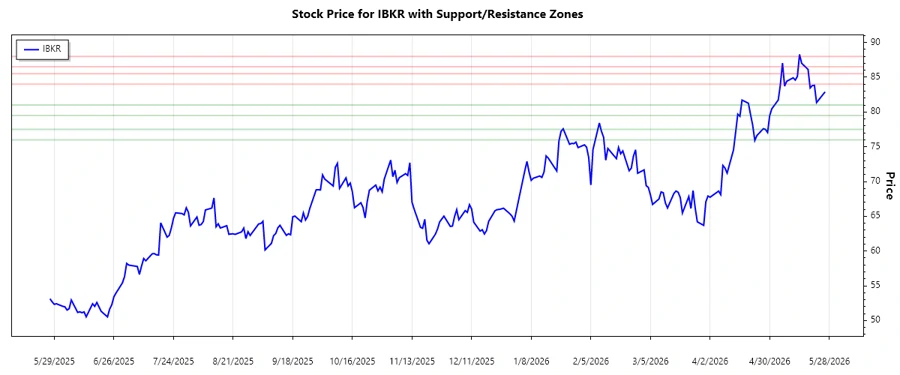
Analyzing recent price movements, key support and resistance levels have been identified. These zones are critical as they can indicate potential reversals or continuation patterns in market trends.
| Zone Type | From | To |
|---|---|---|
| Support | $79.50 | $81.00 |
| Support | $76.00 | $77.50 |
| Resistance | $84.00 | $85.50 |
| Resistance | $86.50 | $88.00 |
Currently, the stock appears to be trading near a resistance zone of $84.00 to $85.50, indicating potential ceiling in pricing.
Conclusion
The recent trading patterns in IBKR suggest an upward trajectory in the short term, impacted by the overall bullish momentum illustrated by EMA crossovers. Despite encountering potential resistance around $85.00, sustained price action above key support zones may encourage bullish sentiment among market participants. Investors should remain vigilant for potential reversals, given the volatility within financial markets and broader economic influences affecting brokerage operations.
Smart Data Insight
Master the Perfect Entry & Exit for this Stock
Don't leave your profits to chance. Historically, this stock follows specific seasonal patterns that institutional traders use to maximize returns.
- ✅ Identify the "Golden Buying Window"
- ✅ Avoid high-risk correction cycles
- ✅ Backtested data from the last 20+ years