January 27, 2026 a 08:15 am

IBKR: Trend and Support & Resistance Analysis - Interactive Brokers Group, Inc.
Interactive Brokers Group, Inc. has demonstrated a significant rebound in its stock price over the observed months. The company's operations in the electronic brokerage sphere have supported its recovery, with gradual increases in its market value. Despite recent fluctuations, the overall progression indicates resilience and adaptability in the competitive financial services market.
Trend Analysis
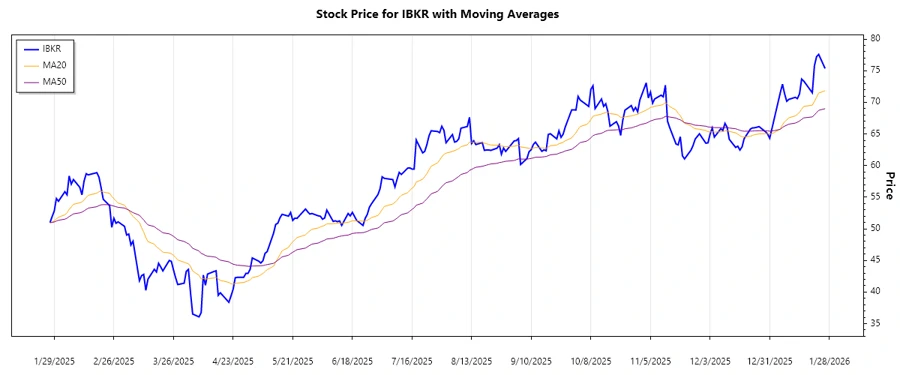
The analysis of the Interactive Brokers Group stock price over recent months has revealed shifting market sentiments. Using EMA calculations over the past 50 days, we determine the prevailing trend.
| Date | Closing Price | Trend |
|---|---|---|
| 2026-01-26 | 75.35 | ▲ |
| 2026-01-23 | 77.58 | ▲ |
| 2026-01-22 | 77.21 | ▲ |
| 2026-01-21 | 75.8 | ▲ |
| 2026-01-20 | 71.51 | ▲ |
| 2026-01-16 | 73.36 | ▲ |
| 2026-01-15 | 73.68 | ▲ |
The analysis suggests that the stock is experiencing an upward trend as the EMA20 crosses above the EMA50, indicating bullish market sentiment.
Support and Resistance
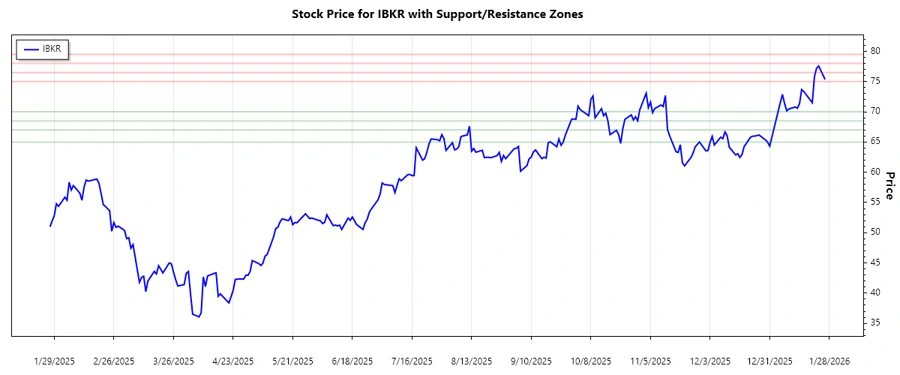
To establish future pricing direction, support and resistance levels have been identified based on historical price closures.
| Zone Type | From Price | To Price |
|---|---|---|
| Support ▲ | 65.00 | 67.00 |
| Support ▲ | 68.50 | 70.00 |
| Resistance ▼ | 75.00 | 76.50 |
| Resistance ▼ | 78.00 | 79.50 |
The current price is approaching a resistance zone, emphasizing caution for potential profit-taking scenarios. The market is amid a testing phase for upper resistance levels.
Conclusion
Interactive Brokers Group, Inc. shows strong potential for continued growth, reflected in the recent upward trend identified in our analysis. The presence near resistance zones warrants careful portfolio management to optimize profits while limiting risk exposure. Analysts are advised to monitor further price movements closely, as navigating these critical levels can offer insights into future volatility and investment opportunities.