November 10, 2025 a 01:15 pm


IBKR: Trend and Support & Resistance Analysis - Interactive Brokers Group, Inc.
Interactive Brokers Group, Inc. operates as a comprehensive electronic broker, providing various trading services across asset classes. Based on recent data analysis, the stock has seen a significant upward trajectory over the past months, with strong support levels underpinning future growth potential. However, potential resistance levels and market volatility warrant cautious optimism.
Trend Analysis
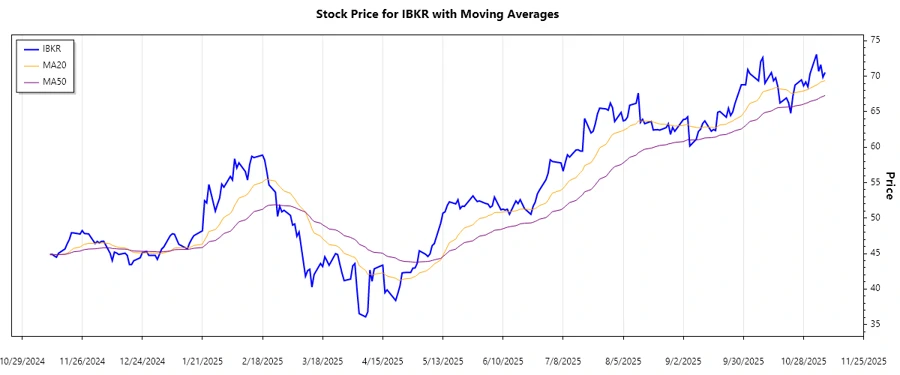
The analysis of closing prices over several months reveals key insights into the trend direction for IBKR. The calculated exponential moving averages (EMA) show:
| Date | Closing Price | Trend |
|---|---|---|
| 2025-11-07 | 70.54 | ▲ |
| 2025-11-06 | 69.86 | ▲ |
| 2025-11-05 | 71.62 | ▲ |
| 2025-11-04 | 70.69 | ▲ |
| 2025-11-03 | 73.08 | ▲ |
| 2025-10-31 | 70.36 | ▲ |
| 2025-10-30 | 68.51 | ▲ |
The EMA20 is consistently above the EMA50, indicating a strong upward trend, suggesting bullish momentum among investors.
Support and Resistance
Based on the closing prices, the analysis identifies potential support and resistance zones:
| Type | Zone From | Zone To |
|---|---|---|
| Support | 66.12 | 68.52 |
| Support | 69.49 | 70.36 |
| Resistance | 71.62 | 73.08 |
| Resistance | 70.69 | 72.62 |
The current price remains within a resistance zone, posing a challenge for breaking and sustaining above these levels.
Conclusion
The current technical indicators suggest an upward trend with strong support levels, providing confidence for investors. However, the proximity to resistance zones highlights potential volatility and the possibility of price consolidation. Institutional and individual investors should consider these dynamics in conjunction with broader market conditions.
Smart Data Insight
Master the Perfect Entry & Exit for this Stock
Don't leave your profits to chance. Historically, this stock follows specific seasonal patterns that institutional traders use to maximize returns.
- ✅ Identify the "Golden Buying Window"
- ✅ Avoid high-risk correction cycles
- ✅ Backtested data from the last 20+ years