February 13, 2026 a 01:00 pm

IBKR: Fundamental Ratio Analysis - Interactive Brokers Group, Inc.
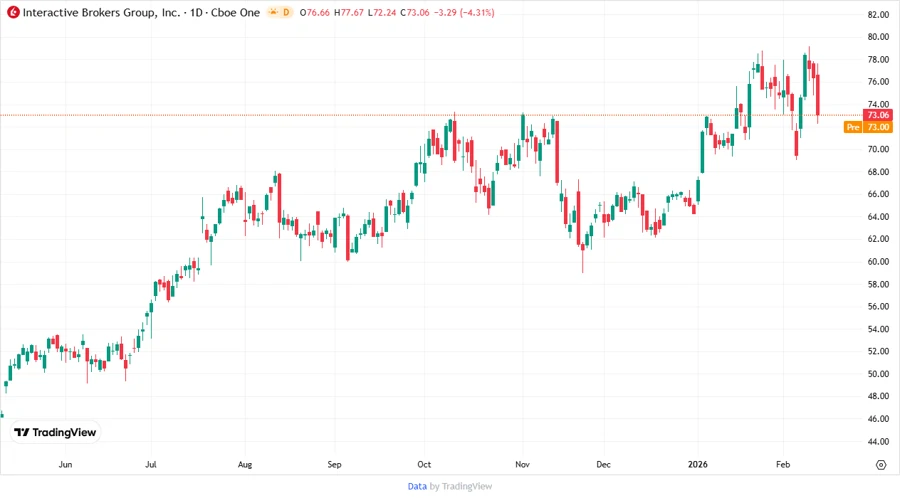
Interactive Brokers Group, Inc. operates as an automated electronic broker and provides services on a global scale. With a diversified business model touching various financial instruments, IBKR provides robust brokerage services to both institutional and individual customers. However, the stock demonstrates a mixed performance in terms of fundamental ratios, which will be explored below.
Fundamentals Rating
The company has a fundamental rating of B+, indicating a fairly strong performance in its financial health and operational metrics.
| Category | Score | Visual |
|---|---|---|
| Discounted Cash Flow | 5 | |
| Return on Equity | 5 | |
| Return on Assets | 2 | |
| Debt to Equity | 4 | |
| Price to Earnings | 1 | |
| Price to Book | 1 |
Historical Rating
The historical scores show consistency in certain aspects, while changes in others indicate shifting performance factors.
| Date | Overall | DCF | ROE | ROA | Debt to Equity | P/E | P/B |
|---|---|---|---|---|---|---|---|
| Current | 3 | 5 | 5 | 2 | 4 | 1 | 1 |
| 2026-02-12 | 3 | 5 | 5 | 2 | 4 | 1 | 1 |
Analyst Price Targets
Analysts offer a range of price targets, with consensus estimates suggesting moderate growth potential.
| High | Low | Median | Consensus |
|---|---|---|---|
| $91 | $80 | $82.5 | $84 |
Analyst Sentiment
Overall, the stock receives a favorable analyst sentiment with the majority recommending a buy position.
| Recommendation | Count | Visual |
|---|---|---|
| Strong Buy | 0 | |
| Buy | 10 | |
| Hold | 8 | |
| Sell | 1 | |
| Strong Sell | 0 |
Conclusion
Interactive Brokers Group, Inc. presents a diverse service offering and a stable performance in specific fundamental metrics. Although the stock has some weaker aspects in price-to-earnings and price-to-book ratios, its strong cash flow and equity returns provide a solid base. Analysts largely support the stock, suggesting potential for price appreciation. However, investors should weigh these strengths against industry volatility and economic conditions. Overall, IBKR offers a compelling investment case for those seeking exposure to the financial brokerage sector.