
July 22, 2026 a 03:30 am

IBKR: Dividend Analysis - Interactive Brokers Group, Inc.
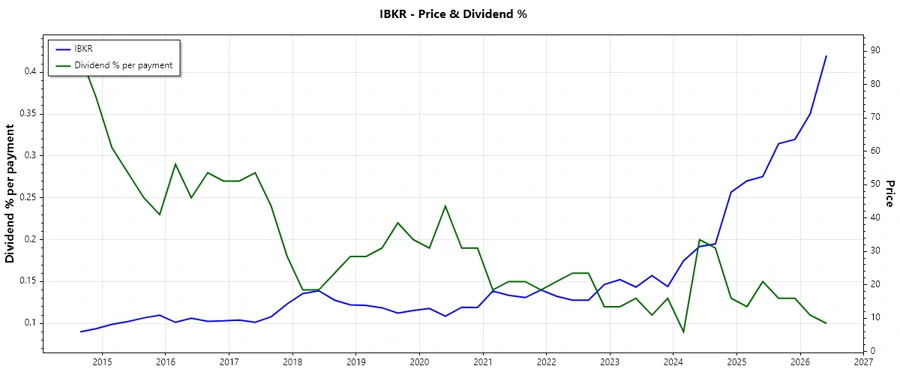
Interactive Brokers Group, Inc. (IBKR) has maintained a modest yet stable dividend profile with growth over recent years. Despite a lower yield, their consistent payout and solid financial metrics make them a topic of interest for dividend-focused investors. Careful analysis of their financial health and payout ratios confirms a balanced approach towards dividends.
📊 Overview
Interactive Brokers Group operates in the financial sector and demonstrates a conservative dividend strategy with a current yield of 0.37%. The company has paid dividends consistently for 17 years. Their conservative approach ensures longevity and stability, despite a relatively low dividend yield.
| Metric | Value |
|---|---|
| Sector | Financials |
| Dividend Yield | 0.37% |
| Current Dividend per Share | 0.30 USD |
| Dividend History | 17 years |
| Last Cut or Suspension | None |
🗣️ Dividend History
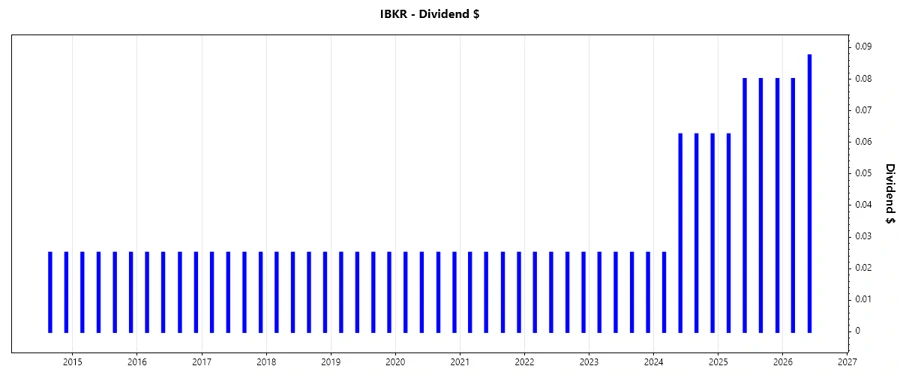
Analyzing the dividend history of IBKR highlights a consistent payout approach. The company has delivered a steady dividend with occasional increments. Such stability can be appealing to conservative investors. Most notably, no cuts have been recorded over recent years.
| Year | Dividend per Share (USD) |
|---|---|
| 2026 | 0.1675 |
| 2025 | 0.3025 |
| 2024 | 0.2125 |
| 2023 | 0.100 |
| 2022 | 0.100 |
📈 Dividend Growth
The dividend growth metric signals the company’s ability to increase payouts over time, reflecting IBKR's commitment to returning value to shareholders. Their dividend growth over 3 and 5 years underscores a strategic enhancement of shareholder rewards.
| Time | Growth |
|---|---|
| 3 years | 44.62% |
| 5 years | 24.78% |
The average dividend growth is 24.78% over 5 years. This shows moderate but steady dividend growth.
💵 Payout Ratio
Payout ratios are crucial to understanding a company’s dividend sustainability. A lower ratio suggests ample earnings retention to support continued growth and dividends.
| Key figure | Ratio |
|---|---|
| EPS-based | 1.89% |
| Free Cash Flow-based | 0.80% |
These payout ratios indicate a very conservative dividend payout strategy, suggesting that IBKR retains a significant portion of its earnings and cash flow, which supports operational flexibility and future growth opportunities.
💸 Cashflow & Capital Efficiency
The financial health of a company is closely tied to its cash flow management and capital allocation efficiency. IBKR showcases robust metrics indicating favorable cash flow and capital management.
| Metric | 2023 | 2024 | 2025 |
|---|---|---|---|
| Free Cash Flow Yield | 51.64% | 45.42% | 54.97% |
| Earnings Yield | 6.89% | 3.95% | 3.44% |
| CAPEX to Operating Cash Flow | 1.08% | 0.56% | 0.42% |
| Stock-based Compensation to Revenue | 1.28% | 1.20% | 1.15% |
| Free Cash Flow / Operating Cash Flow Ratio | 98.92% | 99.44% | 99.58% |
The healthy Free Cash Flow Yield and low CAPEX to Operating Cash Flow ratio confirm IBKR’s financial stability and efficient capital allocation strategy, ensuring sufficient funds are available for dividend payments and growth investments.
📉 Balance Sheet & Leverage Analysis
A strong balance sheet with controlled leverage indicates financial health and protects shareholder value. Monitoring these indicators helps assess solvency and operational risk.
| Metric | 2023 | 2024 | 2025 |
|---|---|---|---|
| Debt-to-Equity | 3.17% | 3.80% | 0.35% |
| Debt-to-Assets | 8.86% | 10.83% | 0.01% |
| Debt-to-Capital | 76.02% | 79.16% | 0.35% |
| Net Debt to EBITDA | 1.15 | 1.58 | -0.54 |
| Current Ratio | 1.12 | 1.16 | 8973.08 |
| Quick Ratio | 1.12 | 1.16 | 1.13 |
| Financial Leverage | 35.78 | 35.08 | 37.90 |
IBKR's impressive leverage and liquidity position, marked by a near-zero debt-to-equity ratio in 2025, indicates solid financial health, ensuring financial resilience and capacity for strategic investments.
✅ Fundamental Strength & Profitability
Key profitability ratios like Return on Equity (ROE) and margins speak to the company’s efficiency and capability to generate returns on investments.
| Metric | 2023 | 2024 | 2025 |
|---|---|---|---|
| Return on Equity | 16.74% | 17.64% | 18.35% |
| Return on Assets | 0.47% | 0.50% | 0.48% |
| Net Profit Margin | 7.71% | 8.10% | 9.62% |
| EBIT Margin | 83.54% | 84.65% | 87.86% |
| EBITDA Margin | 84.81% | 85.73% | 88.81% |
| Gross Margin | 88.28% | 89.04% | 89.77% |
| Research & Development to Revenue | 0% | 0% | 0% |
These factors underscore the company's intrinsic strength, indicated by robust profit margins and a solid ROE, confirming Interactive Brokers' efficiency driven by its operational model.
📈 Price Development
💡 Dividend Scoring System
| Criteria | Score | Scale |
|---|---|---|
| Dividend Yield | 2 | |
| Dividend Stability | 4 | |
| Dividend Growth | 3 | |
| Payout Ratio | 5 | |
| Financial Stability | 5 | |
| Dividend Continuity | 4 | |
| Cashflow Coverage | 5 | |
| Balance Sheet Quality | 5 |
Total Score: 33 out of 40
⚠️ Rating
Interactive Brokers Group, Inc. (IBKR) showcases a formidable financial profile with solid balance sheet metrics and consistent dividend payments. Despite a low yield, the payout stability and growth potential remain attractive. Cautious investors may view IBKR as a reliable addition to a diversified dividend portfolio.
Smart Data Insight
Master the Perfect Entry & Exit for this Stock
Don't leave your profits to chance. Historically, this stock follows specific seasonal patterns that institutional traders use to maximize returns.
- ✅ Identify the "Golden Buying Window"
- ✅ Avoid high-risk correction cycles
- ✅ Backtested data from the last 20+ years