February 12, 2026 a 07:46 am

IBKR: Dividend Analysis - Interactive Brokers Group, Inc.
Interactive Brokers Group, Inc. presents a moderate dividend yield, supported by moderate growth and a consistent history. The firm's financial stability, reflected in its low payout ratios, enhances its ability to sustain reliable dividends. Overall, its prudent financial management positions it well for continued dividend distribution.
📊 Overview
Interactive Brokers Group, Inc. operates in a robust sector underpinned by consistent financials. Its dividend yield is not exceptionally high, but it reflects the company's solid performance and potential for future payments.
| Property | Detail |
|---|---|
| Sector | Finance |
| Dividend yield | 0.42% |
| Current dividend per share | 0.3025 USD |
| Dividend history | 17 years |
| Last cut or suspension | None |
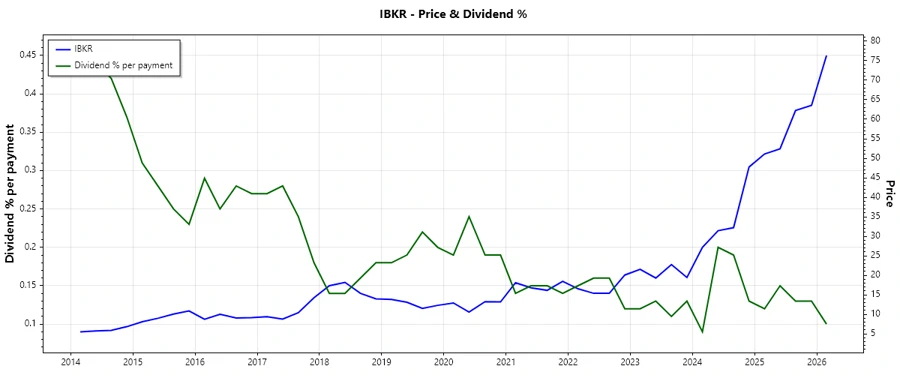
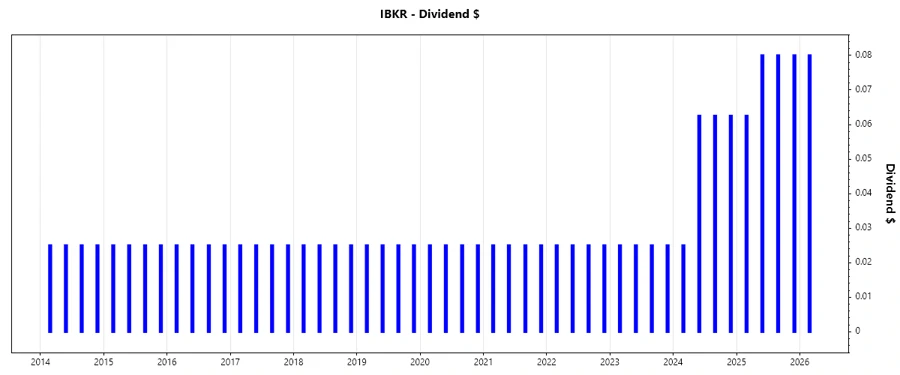
🗣️ Dividend History
Analyzing the dividend history offers insights into a company's commitment to shareholders. A stable, increasing dividend indicates financial health and management's dedication to returning profits to investors.
| Year | Dividend per Share (USD) |
|---|---|
| 2026 | 0.08 |
| 2025 | 0.3025 |
| 2024 | 0.2125 |
| 2023 | 0.1 |
| 2022 | 0.1 |
📈 Dividend Growth
The growth rate of dividends is crucial for long-term investors who seek income that increases over time. A steady growth in dividends can be a sign of sustainable financial performance.
| Time | Growth |
|---|---|
| 3 years | 0.45% |
| 5 years | 0.25% |
The average dividend growth is 0.25% over 5 years. This shows moderate but steady dividend growth.
⚠️ Payout Ratio
Payout ratios are critical in evaluating a firm’s ability to continue paying dividends. A lower ratio reflects a greater margin for the company to sustain or increase dividends even during economic reverses.
| Key figure | Ratio |
|---|---|
| EPS-based | 91% |
| Free cash flow-based | 84% |
With EPS at 91% and FCF at 84%, the payout ratios are slightly elevated, implying a significant portion of profits is distributed as dividends, with limited room for increases without profit growth.
✅ Cashflow & Capital Efficiency
Evaluating cash flow efficiency and capital utilization are critical in assessing a company's financial stability and its ability to fund dividends sustainably.
| Metric | 2023 | 2024 | 2025 |
|---|---|---|---|
| Free Cash Flow Yield | 5.16% | 45.42% | 0% |
| Earnings Yield | 6.89% | 3.95% | 3.44% |
| CAPEX to Operating Cash Flow | 1.08% | 0.56% | 0% |
| Stock-based Compensation to Revenue | 1.28% | 1.20% | 0% |
| Free Cash Flow / Operating Cash Flow Ratio | 98.92% | 99.44% | 0% |
This analysis underscores a robust cash flow which supports dividend sustainability. The efficiency in capital deployment reaffirms positive prospects for the company's dividend policy.
📉 Balance Sheet & Leverage Analysis
A company's balance sheet is an indicator of financial stability and risk. Leverage metrics reveal the extent of debt risk relative to equity, which can impact dividend policy and financial flexibility.
| Metric | 2023 | 2024 | 2025 |
|---|---|---|---|
| Debt-to-Equity | 3.17 | 3.80 | 0.004 |
| Debt-to-Assets | 0.089 | 0.108 | 0.0001 |
| Debt-to-Capita | 0.760 | 0.792 | 0.0035 |
| Net Debt to EBITDA | 1.15 | 1.58 | -0.544 |
| Current Ratio | 1.12 | 1.16 | 0.61 |
| Quick Ratio | 1.12 | 1.16 | 0.61 |
| Financial Leverage | 35.78 | 35.08 | 37.90 |
The leverage ratios reflect controlled financial risk, signifying the firm's caution against excessive debt. This prudent approach supports a sustainable dividend strategy.
📈 Fundamental Strength & Profitability
Metrics like ROE and net margins are crucial for evaluating profitability and assessing how effectively a company generates profit from its resources.
| Metric | 2023 | 2024 | 2025 |
|---|---|---|---|
| Return on Equity | 16.74% | 17.64% | 18.35% |
| Return on Assets | 0.47% | 0.50% | 0.48% |
| Net Margin | 7.71% | 8.10% | 9.62% |
| EBIT Margin | 83.54% | 84.65% | 87.86% |
| EBITDA Margin | 84.81% | 85.73% | 88.81% |
| Gross Margin | 88.28% | 89.04% | 89.78% |
The profitability margins indicate strong operational efficiency, which bodes well for maintaining competitive dividend payouts. The high ROE epitomizes a well-managed utilization of equity capital.
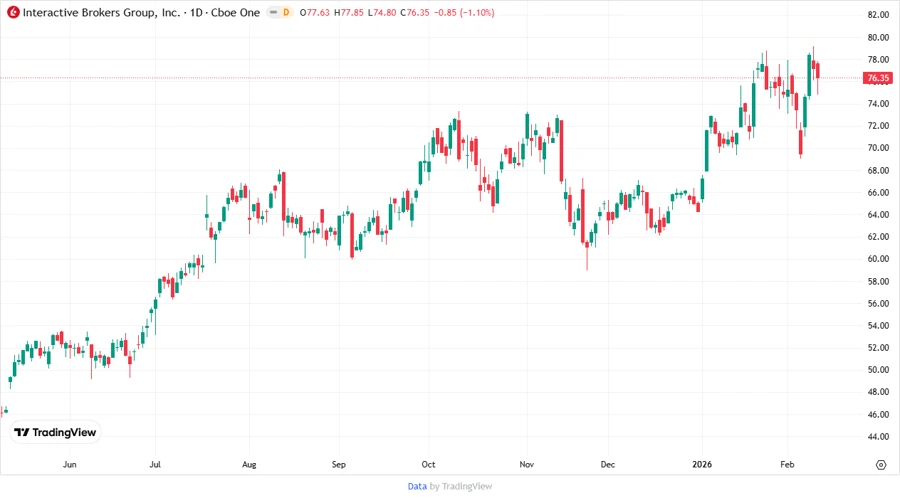
🗣️ Price Development
🎯 Dividend Scoring System
This scoring evaluates Interactive Brokers Group against various dividend-related criteria.
| Criterion | Score | |
|---|---|---|
| Dividend yield | 2 | |
| Dividend Stability | 4 | |
| Dividend growth | 3 | |
| Payout ratio | 3 | |
| Financial stability | 4 | |
| Dividend continuity | 4 | |
| Cashflow Coverage | 3 | |
| Balance Sheet Quality | 4 |
Overall Score: 27/40
🗣️ Rating
Interactive Brokers Group, Inc. demonstrates a balanced dividend strategy with reliable payment history and moderate growth. Its financial strength and ability to uphold consistent dividends render it an attractive option for income-seeking investors. Overall, it receives a 'Hold' recommendation for investors aiming for moderate dividend yield with growth prospects.
Smart Data Insight
Master the Perfect Entry & Exit for this Stock
Don't leave your profits to chance. Historically, this stock follows specific seasonal patterns that institutional traders use to maximize returns.
- ✅ Identify the "Golden Buying Window"
- ✅ Avoid high-risk correction cycles
- ✅ Backtested data from the last 20+ years