November 23, 2025 a 03:30 am


IBKR: Dividend Analysis - Interactive Brokers Group, Inc.
Interactive Brokers Group, Inc. demonstrates a steady approach to managing its dividend payments, with a consistent history over the past 16 years. Despite a low dividend yield of 0.50%, the company's efforts in sustaining dividends highlight its focus on shareholder value. Though last cut in 2013, it has since maintained consistent payouts, reassuring long-term investors.
📊 Overview
| Metric | Value |
|---|---|
| Sector | Financial Services |
| Dividend yield | 0.50% |
| Current dividend per share | 0.21 USD |
| Dividend history | 16 years |
| Last cut or suspension | 2013 |
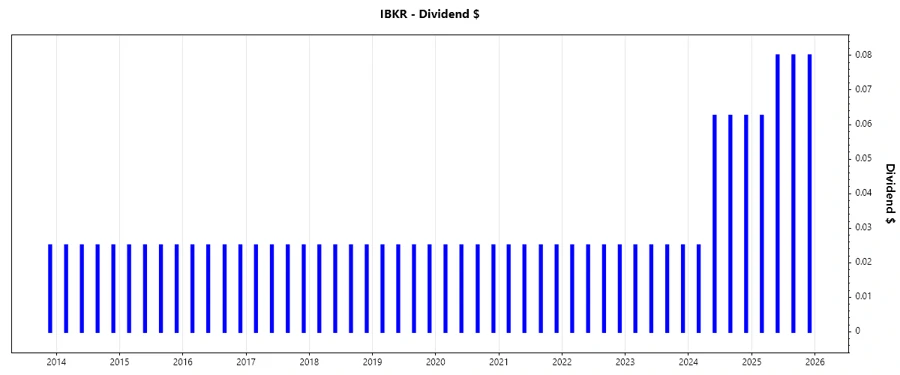
📈 Dividend History
Understanding the dividend history of Interactive Brokers Group is essential for evaluating the stability and predictability of future payouts. The consistent dividend payments over recent years indicate robust operational profitability.
| Year | Dividend per Share (USD) |
|---|---|
| 2025 | 0.3025 |
| 2024 | 0.2125 |
| 2023 | 0.100 |
| 2022 | 0.100 |
| 2021 | 0.100 |
🗣️ Dividend Growth
The growth in dividends is a crucial metric that signals the potential for future income. Interactive Brokers displays a 3-year growth rate of 28.56% and a 5-year growth rate of 16.27%, illustrating a moderate upward trend in dividend distributions.
| Time | Growth |
|---|---|
| 3 years | 28.56% |
| 5 years | 16.27% |
The average dividend growth is 16.27% over 5 years. This shows moderate but steady dividend growth.
✅ Payout Ratio
Payout ratios are key in assessing the sustainability of dividends. A ratio aligned with earnings and cash flows usually indicates stability in future dividend payments.
| Key figure | Ratio |
|---|---|
| EPS-based | 68.47% |
| Free cash flow-based | 59.29% |
The payout ratio at 68.47% based on EPS suggests a cautious balance, ensuring sufficient retained earnings for potential growth while rewarding shareholders. The FCF-based ratio of 59.29% supports this conclusion, reinforcing the company's stable cash flow foundation for payouts.
⚠️ Cashflow & Capital Efficiency
Cash flow and capital efficiency metrics offer a deeper view into the company’s operational amplitude and its capital management effectiveness.
| Year | 2024 | 2023 | 2022 |
|---|---|---|---|
| Free Cash Flow Yield | 39.06% | 51.64% | 53.64% |
| Earnings Yield | 3.38% | 6.89% | 5.23% |
| CAPEX/Operating Cash Flow | 0.37% | 0.65% | 1.74% |
| Stock-Based Compensation/Revenue | 1.22% | 1.28% | 2.19% |
| Free Cash Flow / Operating Cash Flow Ratio | 99.44% | 98.92% | 98.26% |
The data reflects strong cash flow metrics, highlighting operational competence and effective capital deployment. A high free cash flow yield suggests ample liquidity to sustain and potentially expand dividends.
⚖️ Balance Sheet & Leverage Analysis
Analyzing the balance sheet and leverage provides insight into the company's financial foundation and its risk profile concerning debt management.
| Year | 2024 | 2023 | 2022 |
|---|---|---|---|
| Debt-to-Equity | 3.80 | 3.17 | 3.15 |
| Debt-to-Assets | 10.83% | 8.86% | 7.78% |
| Debt-to-Capital | 79.16% | 76.02% | 75.88% |
| Net Debt to EBITDA | 2.58 | 1.15 | 1.78 |
| Current Ratio | 19505.6 | 1.12 | 1.09 |
| Quick Ratio | 1.16 | 1.12 | 1.09 |
| Financial Leverage | 35.08 | 35.78 | 40.43 |
The figures indicate a significant reliance on equity financing. Notably, the reasonable current and quick ratios suggest adequate liquidity to cover short-term obligations, enhancing financial sustainability against leverage challenges.
📊 Fundamental Strength & Profitability
Examining profitability metrics gives a comprehensive understanding of operational success and strategic performance in generating returns.
| Year | 2024 | 2023 | 2022 |
|---|---|---|---|
| Return on Equity | 17.64% | 16.74% | 13.34% |
| Return on Assets | 0.50% | 0.47% | 0.33% |
| Net Margin | 8.10% | 7.71% | 9.06% |
| EBIT Margin | 84.65% | 83.54% | 71.95% |
| EBITDA Margin | 85.73% | 84.81% | 74.09% |
| Gross Margin | 89.04% | 88.28% | 81.44% |
| R&D to Revenue | 0.00% | 0.00% | 0.00% |
Strong fundamental metrics, albeit lacking R&D investment, highlight robust asset management and cost efficiency. The commendable profit margins and ROE indicate a solid profitability trajectory.
🔍 Price Development
🔢 Dividend Scoring System
| Criteria | Score | Score Bar |
|---|---|---|
| Dividend Yield | 3 | |
| Dividend Stability | 4 | |
| Dividend Growth | 3 | |
| Payout Ratio | 4 | |
| Financial Stability | 4 | |
| Dividend Continuity | 3 | |
| Cashflow Coverage | 4 | |
| Balance Sheet Quality | 3 |
Overall Score: 28/40
📉 Rating
The dividend profile of Interactive Brokers Group, Inc. reflects a reliable foundation with moderate growth and resilience. While the current yield is modest, the company's commitment to sustaining dividends is commendable. Investors seeking stability with a focus on long-term capital appreciation may find Interactive Brokers a suitable consideration. Nevertheless, the limited dividend yield might not align with the goals of income-focused investors.
Smart Data Insight
Master the Perfect Entry & Exit for this Stock
Don't leave your profits to chance. Historically, this stock follows specific seasonal patterns that institutional traders use to maximize returns.
- ✅ Identify the "Golden Buying Window"
- ✅ Avoid high-risk correction cycles
- ✅ Backtested data from the last 20+ years