October 25, 2025 a 03:31 pm

IBKR: Dividend Analysis - Interactive Brokers Group, Inc.
Interactive Brokers Group, Inc. presents a unique dividend profile with a modest dividend yield that reflects a conservative payout strategy. The company has demonstrated consistent dividend growth over the past years, which may appeal to investors seeking steady income. Despite a relatively low yield, its financial stability is underscored by a strong balance sheet and solid cash flow generation, making it a potentially attractive investment for risk-averse investors.
📊 Overview
Interactive Brokers Group, Inc. operates within the financial services sector, showing a restrained yet progressive dividend strategy. The company has consistently paid dividends for 16 years, underscoring its commitment to returning value to shareholders.
| Attribute | Value |
|---|---|
| Sector | Financial Services |
| Dividend yield | 0.41 % |
| Current dividend per share | 0.21 USD |
| Dividend history | 16 years |
| Last cut or suspension | 2013 |
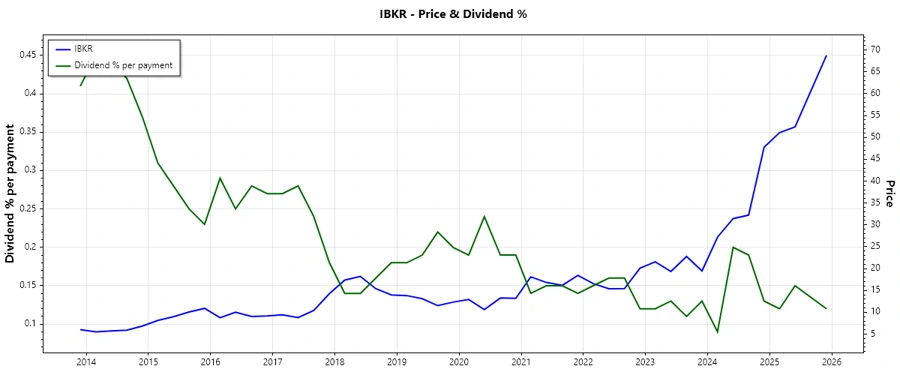
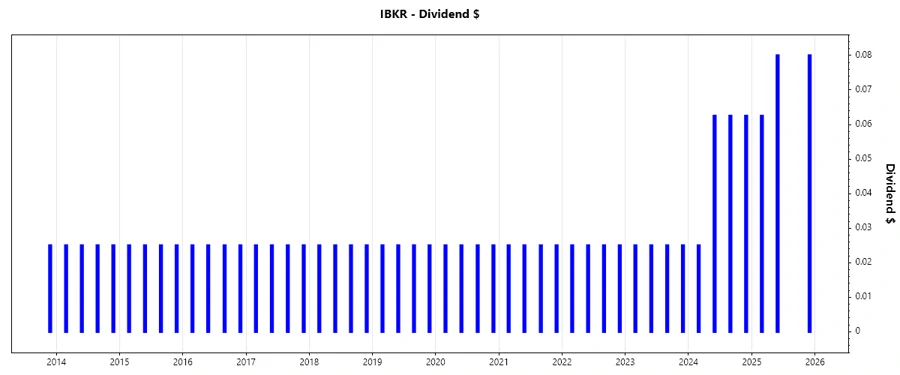
📈 Dividend History
The dividend history of Interactive Brokers displays a disciplined and steady approach in delivering shareholder returns. This longevity in maintaining dividends without major disruptions is crucial for income-focused investors.
| Year | Dividend per Share (USD) |
|---|---|
| 2025 | 0.2225 |
| 2024 | 0.2125 |
| 2023 | 0.100 |
| 2022 | 0.100 |
| 2021 | 0.100 |
📉 Dividend Growth
The dividend growth for Interactive Brokers Group is modest but holds a steady upward trajectory. Over the past 5 years, the company has demonstrated a controlled strategy toward increasing returns, suitable for investors prioritizing gradual growth.
| Time | Growth |
|---|---|
| 3 years | 28.56 % |
| 5 years | 16.27 % |
The average dividend growth is 16.27 % over 5 years. This shows moderate but steady dividend growth.
✅ Payout Ratio
Payout ratios are critical indicators of dividend sustainability. Interactive Brokers' EPS-based payout ratio is considerably low, while its cash flow-based ratio demonstrates its ability to sustain dividends through free cash.
| Key figure | Ratio |
|---|---|
| EPS-based | 68.47 % |
| Free cash flow-based | 62.62 % |
Given these ratios, Interactive Brokers maintains a conservative payout approach, focusing on its EPS and free cash flow, ensuring dividend sustainability even during market fluctuations.
💵 Cashflow & Capital Efficiency
An analysis of cash flow metrics highlights Interactive Brokers' keen management over operational and investment efficiencies. The company displays a strong free cash flow yield, indicating robust cash generation capabilities.
| Metric | 2022 | 2023 | 2024 |
|---|---|---|---|
| Free Cash Flow Yield | 53.64 % | 51.64 % | 45.41 % |
| Earnings Yield | 5.23 % | 6.89 % | 3.95 % |
| CAPEX to Operating Cash Flow | 1.74 % | 1.08 % | 0.56 % |
| Stock-based Compensation to Revenue | 2.19 % | 1.28 % | 1.20 % |
| Free Cash Flow / Operating Cash Flow Ratio | 98.26 % | 98.92 % | 99.44 % |
Interactive Brokers shows commendable cash flow stability with an impressive conversion of operating cash flow into free cash flow, assisted by minimal CAPEX requirements.
💼 Balance Sheet & Leverage Analysis
Examining leverage ratios gives insights into the company's capital structure and debt management. Interactive Brokers operates with high financial leverage, indicating potential risk under high-debt scenarios.
| Metric | 2022 | 2023 | 2024 |
|---|---|---|---|
| Debt-to-Equity | 314.54 % | 317.08 % | 379.95 % |
| Debt-to-Assets | 7.78 % | 8.86 % | 10.83 % |
| Debt-to-Capital | 75.88 % | 76.02 % | 79.16 % |
| Net Debt to EBITDA | 1.78 | 1.15 | 1.58 |
| Current Ratio | 109.10 % | 111.58 % | 115.58 % |
| Quick Ratio | 109.10 % | 111.58 % | 115.58 % |
| Financial Leverage | 4042.94 % | 3578.43 % | 3507.99 % |
Though highly levered, Interactive Brokers maintains its solvency with ample liquidity metrics such as its quick and current ratios, allowing flexibility in financial maneuvering.
📌 Fundamental Strength & Profitability
The fundamentals of Interactive Brokers are marked by commendable returns on equity and assets, facilitated by efficient resource utilization and revenue retention ratios.
| Metric | 2022 | 2023 | 2024 |
|---|---|---|---|
| Return on Equity | 13.34 % | 16.74 % | 17.64 % |
| Return on Assets | 0.33 % | 0.46 % | 0.50 % |
| Net Margin | 9.06 % | 7.71 % | 8.10 % |
| EBIT Margin | 71.95 % | 83.54 % | 84.65 % |
| EBITDA Margin | 74.09 % | 84.81 % | 85.73 % |
| Gross Margin | 81.44 % | 88.28 % | 89.04 % |
| R&D to Revenue | 0 % | 0 % | 0 % |
The robust margins indicate interactive Brokers' strong control over operational costs, while high returns suggest a competitive advantage in asset and equity management.
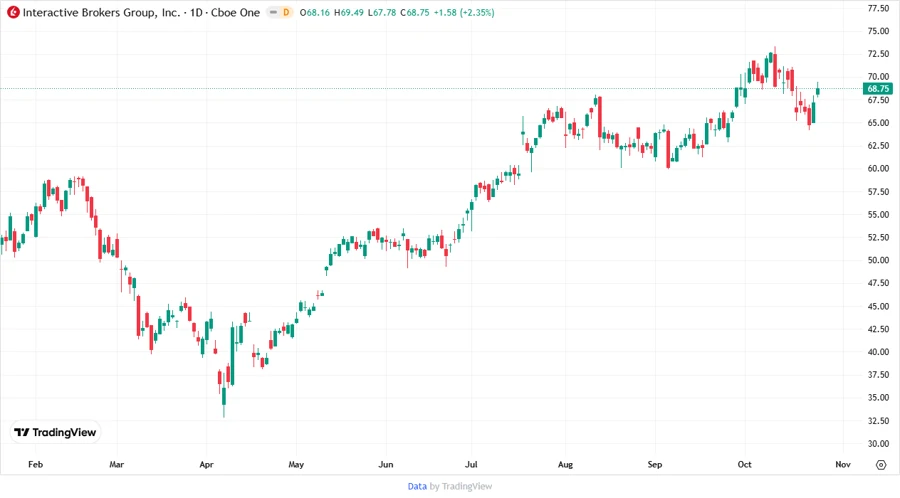
📈 Price Development
🔍 Dividend Scoring System
Interactive Brokers' diverse dividend metrics have been evaluated to offer a score indicating its overall dividend investment appeal.
| Category | Score (Out of 5) | Score Bar |
|---|---|---|
| Dividend Yield | 2 | |
| Dividend Stability | 5 | |
| Dividend Growth | 3 | |
| Payout Ratio | 3 | |
| Financial Stability | 4 | |
| Dividend Continuity | 5 | |
| Cashflow Coverage | 4 | |
| Balance Sheet Quality | 3 |
Total Score: 29/40
🗣️ Rating
Interactive Brokers Group, Inc. shows a strong commitment to its dividend payments with a foundation rooted in stability and progressive growth. While the dividend yield is modest, it is supported by consistent financial and operational health, making it a prudent choice for conservative investors seeking reliability and potential capital appreciation.