
May 31, 2026 a 09:31 am


Healthcare Stocks - Performance Analysis
📊 The healthcare sector has experienced a dynamic range of performances over recent periods. A blend of notable gains and decreases were observed, reflecting market volatility and sector-specific influences. The individual stock performances reveal underlying market shifts and company-specific responses to economic factors. Understanding these variations aids in discerning potential investment strategies and risk assessments.
Healthcare Stocks Performance One Week
| Stock | Performance (%) | Performance |
|---|---|---|
| TMO | 9.66 | |
| LLY | 3.81 | |
| ABBV | 0.95 | |
| AMGN | -0.74 | |
| UNH | -2.06 | |
| ABT | -2.08 | |
| ISRG | -3.02 | |
| MRK | -3.04 | |
| JNJ | -3.88 |
Healthcare Stocks Performance One Month
| Stock | Performance (%) | Performance |
|---|---|---|
| LLY | 14.12 | |
| MRK | 5.95 | |
| ABBV | 5.38 | |
| TMO | 5.27 | |
| UNH | 3.30 | |
| AMGN | 2.22 | |
| JNJ | -0.69 | |
| ABT | -4.18 | |
| ISRG | -6.99 |
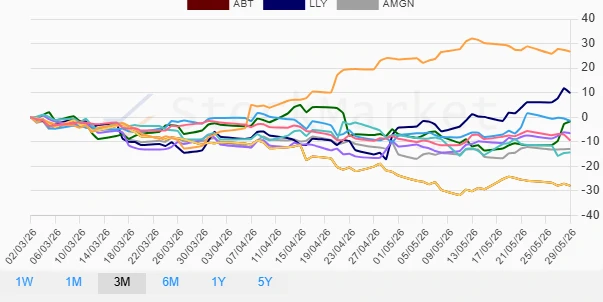
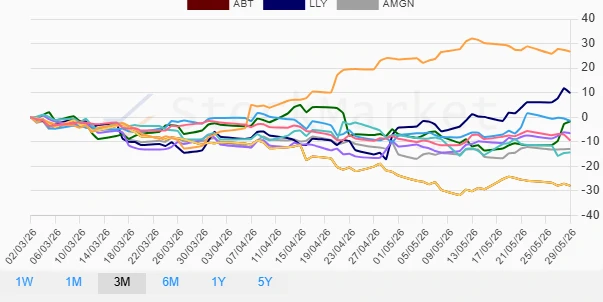
Healthcare Stocks Performance Three Months
| Stock | Performance (%) | Performance |
|---|---|---|
| UNH | 26.79 | |
| LLY | 9.87 | |
| MRK | -1.48 | |
| TMO | -1.69 | |
| ABBV | -6.54 | |
| AMGN | -12.92 | |
| ISRG | -14.31 | |
| JNJ | -9.47 | |
| ABT | -27.92 |
Summary
✅ Over the varied periods analyzed, notable performers like UnitedHealth Group (UNH) have shown impressive resilience with significant upward trends in the three months span. Conversely, Abbott Laboratories (ABT) struggled with consistent declines, notably in the extended three months period. The sector overall is marked by strong variability, which may suggest opportunities for investors willing to navigate the volatility. Constantly monitoring these sector-specific trends and individual stock movements can be key to optimizing portfolio strategies in the healthcare sector. Investors may consider a balanced approach, closely analyzing both potential high-yield performers and understanding the risks inherent to the sector's underperformers.
Smart Data Insight
Master the Perfect Entry & Exit for this Stock
Don't leave your profits to chance. Historically, this stock follows specific seasonal patterns that institutional traders use to maximize returns.
- ✅ Identify the "Golden Buying Window"
- ✅ Avoid high-risk correction cycles
- ✅ Backtested data from the last 20+ years