
April 26, 2026 a 09:31 am


Healthcare Stocks - Performance Analysis
This comprehensive analysis of the healthcare sector highlights a varied performance of major stocks across different time horizons - 1 week, 1 month, and 3 months. The data showcases dynamic shifts, influenced by market conditions, regulatory changes, and macroeconomic factors. Investors should focus on the longer-term trends and adjust their portfolios considering the high volatility within the sector.
📊 Healthcare Stocks Performance One Week
During the past week, UnitedHealth Group (UNH) demonstrated exceptional performance amidst an overall bearish sentiment within the healthcare sector. Most stocks in this segment faced downward pressures, notably Thermo Fisher Scientific (TMO) and Merck & Co. (MRK), which recorded significant declines. This suggests that market jitters could be inducing sector-specific rotations.
| Stock | Performance (%) | Performance |
|---|---|---|
| UNH | 9.17 | |
| ISRG | 3.04 | |
| JNJ | -2.84 | |
| AMGN | -3.04 | |
| LLY | -4.65 | |
| ABBV | -4.69 | |
| ABT | -5.97 | |
| MRK | -6.08 | |
| TMO | -10.97 |
Healthcare Stocks Performance One Month
The one-month outlook paints a mixed picture, with UNH leading the charge at an impressive 32.33% gain, indicating robust growth potentially buoyed by positive earnings or favorable news. Conversely, Abbott Laboratories (ABT) faced significant challenges, seeing a double-digit decline, marking one of the largest falloffs for this period.
| Stock | Performance (%) | Performance |
|---|---|---|
| UNH | 32.33 | |
| ISRG | 6.80 | |
| LLY | 1.04 | |
| TMO | -0.08 | |
| AMGN | -1.05 | |
| ABBV | -5.01 | |
| JNJ | -5.43 | |
| MRK | -6.39 | |
| ABT | -12.85 |
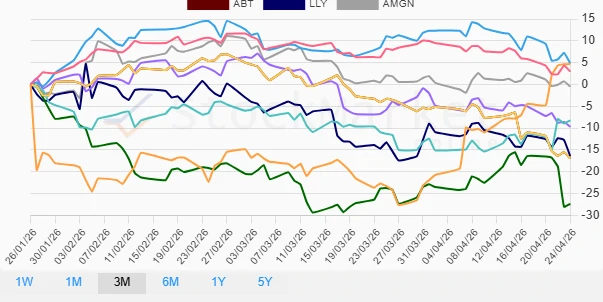
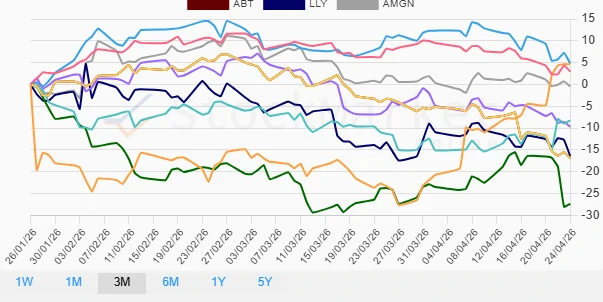
Healthcare Stocks Performance Three Months
Over three months, the healthcare sector faced numerous headwinds, manifesting in lackluster performances from significant players like Abbott (ABT) and Thermo Fisher (TMO). Merck (MRK) emerged resiliently with marginal positive gains, reflecting its stable fundamentals in turbulent times. Energy towards portfolio diversification and risk management is essential for stakeholders in this uncertain environment.
| Stock | Performance (%) | Performance |
|---|---|---|
| MRK | 4.89 | |
| UNH | 4.72 | |
| JNJ | 2.99 | |
| AMGN | -0.46 | |
| ISRG | -8.21 | |
| ABBV | -9.69 | |
| LLY | -16.39 | |
| ABT | -16.95 | |
| TMO | -27.38 |
Summary
⚠️ The healthcare sector is currently displaying significant volatility, with substantial gains and sharp declines intertwined across various stocks over different time periods. It is imperative to remain vigilant and adaptable to market trends, focusing on strong fundamentals and potential growth indicators. Diversification within healthcare investments may serve as a prudent strategy to mitigate risks while capitalizing on upward movements in selected stocks.
Smart Data Insight
Master the Perfect Entry & Exit for this Stock
Don't leave your profits to chance. Historically, this stock follows specific seasonal patterns that institutional traders use to maximize returns.
- ✅ Identify the "Golden Buying Window"
- ✅ Avoid high-risk correction cycles
- ✅ Backtested data from the last 20+ years