October 19, 2025 a 09:31 am


Healthcare Stocks - Performance Analysis
📊 This analysis delves into the performance trends of major healthcare stocks over three different time frames: 1 week, 1 month, and 3 months. By examining these periods, we aim to identify the top performers and underperformers in the healthcare sector, providing valuable insights for potential investors. This comprehensive review will guide us in understanding market dynamics and making informed financial decisions. 📈📉
Healthcare Stocks Performance One Week
🔍 Over the past week, healthcare stocks displayed varied performance metrics. While some stocks exhibited strong gains, others faced declines due to market volatility. Enabling investors to capitalize on short-term trends, this section highlights the most noteworthy stock movements.
| Stock | Performance (%) | Performance |
|---|---|---|
| ISRG | 3.82 | |
| AMGN | 2.96 | |
| TMO | 2.68 | |
| JNJ | 1.30 | |
| UNH | 0.60 | |
| ABBV | -0.39 | |
| MRK | -1.40 | |
| ABT | -3.03 | |
| LLY | -3.69 |
📈 Stocks like ISRG and AMGN led the gains, significantly outperforming peers, while ABT and LLY experienced notable declines. This divergence presents potential opportunities for strategic allocation adjustments. ✅
Healthcare Stocks Performance One Month
🔍 Over the month, the healthcare sector demonstrated substantial growth, with several stocks posting impressive gains. Emit meaningful discussions on tactical investment approaches leveraging these temporal variations.
| Stock | Performance (%) | Performance |
|---|---|---|
| TMO | 12.35 | |
| JNJ | 9.28 | |
| LLY | 7.19 | |
| AMGN | 4.89 | |
| MRK | 4.53 | |
| ABBV | 3.49 | |
| ISRG | 1.89 | |
| UNH | 5.91 | |
| ABT | -5.57 |
📈 TMO led the monthly rally, with significant gains in the sector. Although ABT lagged, the overall metrics indicate positive momentum, offering avenues for targeted investments. ✅
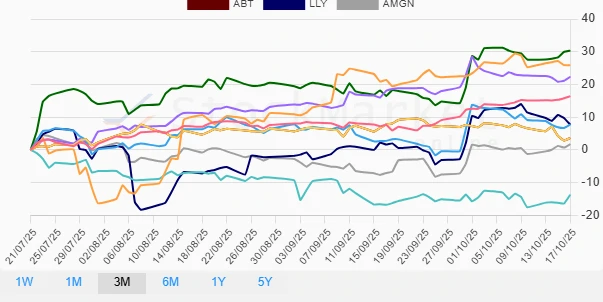
Healthcare Stocks Performance Three Months
🔍 The three-month performance assessment provides a comprehensive view of longer-term trends prevailing in the healthcare sector, highlighting stocks with consistent performance metrics.
| Stock | Performance (%) | Performance |
|---|---|---|
| TMO | 30.33 | |
| UNH | 25.89 | |
| ABBV | 22.32 | |
| JNJ | 16.38 | |
| MRK | 7.76 | |
| LLY | 7.76 | |
| ABT | 3.60 | |
| AMGN | 1.74 | |
| ISRG | -13.71 |
📈 The three-month trends show substantial movements across the sector. TMO and UNH topped the list, illustrating robustness in market dynamics, while ISRG faced significant challenges. This trend provides crucial insights for aligning long-term investment strategies. ✅
Summary
💡 The analysis showcases the dynamic nature of healthcare stocks, with significant variances across different timelines. TMO has consistently shown strong performance, establishing itself as a reliable investment candidate. Conversely, ISRG has shown vulnerability, warranting caution. Strategic investments and thorough sector knowledge will be essential for navigating the nuanced landscape of healthcare equities. ⚠️
Smart Data Insight
Master the Perfect Entry & Exit for this Stock
Don't leave your profits to chance. Historically, this stock follows specific seasonal patterns that institutional traders use to maximize returns.
- ✅ Identify the "Golden Buying Window"
- ✅ Avoid high-risk correction cycles
- ✅ Backtested data from the last 20+ years