
April 19, 2026 a 09:31 am


Healthcare Stocks - Performance Analysis
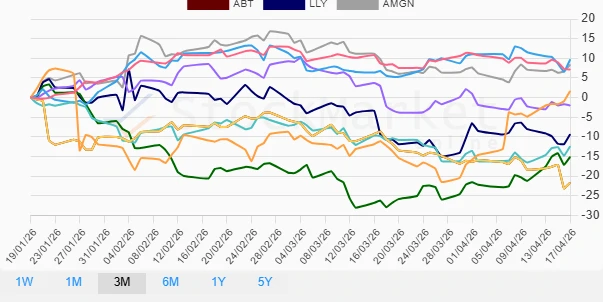
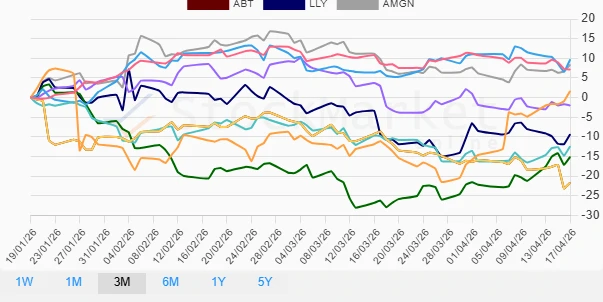
📊 The healthcare sector has showcased diverse performance trends over recent periods. Short-term momentum reveals distinct winners and laggards, reflecting market sentiment and sector-specific developments. This analysis delves into these performance patterns over different durations, helping investors identify potential opportunities and risks. Let's explore how top stocks have fared over the past week, month, and quarter.
Healthcare Stocks Performance One Week
🗣️ Over the past week, UnitedHealth Group Incorporated (UNH) emerges as a remarkable performer with a 6.54% increase, underpinned by strong financial results. Thermo Fisher Scientific Inc. (TMO) also shows impressive gains, ascending by 6.12%. In contrast, Abbott Laboratories (ABT) registers the most significant decline, dropping by 3.35%. These performance metrics suggest a mixed sentiment within the healthcare sector, influenced by individual company dynamics and broader market conditions.
| Stock | Performance (%) | Performance |
|---|---|---|
| UNH | 6.54 | |
| TMO | 6.12 | |
| ISRG | 4.13 | |
| AMGN | 1.23 | |
| ABBV | 0.23 | |
| LLY | -1.27 | |
| JNJ | -1.79 | |
| MRK | -1.87 | |
| ABT | -3.35 |
Healthcare Stocks Performance One Month
📈 The one-month analysis highlights UnitedHealth Group Incorporated (UNH) as the standout leader with a significant 17.05% surge, supported by favorable market dynamics. Thermo Fisher Scientific Inc. (TMO) follows with a 10.77% rise. However, Abbott Laboratories (ABT), with a hefty decline of 8.27%, underscores potential challenges. This period illustrates a continuation of sector bifurcation, with certain stocks outperforming their peers due to fundamental and technical support.
| Stock | Performance (%) | Performance |
|---|---|---|
| UNH | 17.05 | |
| TMO | 10.77 | |
| MRK | 4.40 | |
| LLY | 2.55 | |
| AMGN | 2.30 | |
| ABBV | 1.79 | |
| JNJ | -0.43 | |
| ISRG | -1.61 | |
| ABT | -8.27 |
Healthcare Stocks Performance Three Months
⚠️ The three-month horizon reveals a fluctuation in the performance of major stocks within the healthcare sector. Merck & Co., Inc. (MRK) tops the chart with a 9.68% increase, suggesting strong investor confidence and potential strategic wins. Conversely, Abbott Laboratories (ABT) displays a significant dropdown of 21.71%, highlighting potentially adverse conditions. The wider sector faces mixed fortunes, suggesting caution in investment strategies.
| Stock | Performance (%) | Performance |
|---|---|---|
| MRK | 9.68 | |
| JNJ | 7.12 | |
| AMGN | 8.34 | |
| UNH | 1.67 | |
| ABBV | -2.02 | |
| LLY | -9.32 | |
| ISRG | -12.40 | |
| TMO | -15.08 | |
| ABT | -21.71 |
Summary
💡 The healthcare sector has witnessed significant variance in stock performance over varying timeframes. UnitedHealth Group Inc. consistently leads short to mid-term horizons while Abbott Laboratories faces decline challenges. Investors should weigh individual company fundamentals, sector trends, and broader economic conditions when considering portfolio adjustments in this dynamic environment.
Smart Data Insight
Master the Perfect Entry & Exit for this Stock
Don't leave your profits to chance. Historically, this stock follows specific seasonal patterns that institutional traders use to maximize returns.
- ✅ Identify the "Golden Buying Window"
- ✅ Avoid high-risk correction cycles
- ✅ Backtested data from the last 20+ years