
September 14, 2025 a 09:31 am


Healthcare Stocks - Performance Analysis
📊 The healthcare sector has shown mixed performance over the recent weeks and months. 📈 While certain stocks have surged ahead backed by market drivers and promising institutional earnings, 📉 others faced declines due to market pressures and sector-specific challenges. 🗣️ This analysis delves into the recent performance and trends, providing a comprehensive overview for informed investment decisions.
Healthcare Stocks Performance One Week
🔍 Over the past week, healthcare stocks presented a diverse range of movements. UnitedHealth Group (UNH) emerged as the top performer, gaining significantly, in contrast to Intuitive Surgical (ISRG), which experienced one of the steepest declines. The majority of equities hovered around moderate movements, reflecting sector volatility and macroeconomic indicators.
| Stock | Performance (%) | Performance |
|---|---|---|
| UNH | 11.51 | |
| LLY | 3.82 | |
| ABBV | 2.78 | |
| ABT | 0.64 | |
| JNJ | -0.20 | |
| MRK | -2.22 | |
| TMO | -2.60 | |
| AMGN | -2.54 | |
| ISRG | -3.66 |
Healthcare Stocks Performance One Month
🔍 Throughout the past month, UnitedHealth Group (UNH) maintained its leadership position, further solidifying its growth. Eli Lilly (LLY) and AbbVie (ABBV) also displayed commendable gains, reflecting positive investor sentiment. Conversely, Amgen (AMGN) faced challenges, marking one of the most significant monthly declines, highlighting the competitive dynamics within the sector.
| Stock | Performance (%) | Performance |
|---|---|---|
| UNH | 15.29 | |
| LLY | 7.69 | |
| ABBV | 5.62 | |
| ABT | 1.59 | |
| JNJ | 0.83 | |
| MRK | -1.52 | |
| TMO | -1.72 | |
| ISRG | -6.17 | |
| AMGN | -6.91 |
Healthcare Stocks Performance Three Months
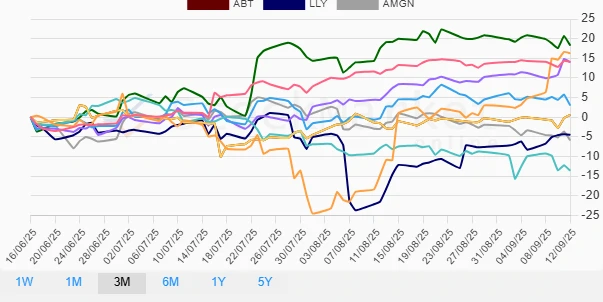
🔍 The quarterly performance displayed a strong showing from Thermo Fisher (TMO), leading the gains significantly, capturing the attention of investors with strategic advancements. In contrast, Intuitive Surgical (ISRG) showed substantial declines, focusing on addressing its market strategies to mitigate losses. Overall, the sector depicts balanced volatility with opportunities for both growth and setbacks.
| Stock | Performance (%) | Performance |
|---|---|---|
| TMO | 18.27 | |
| UNH | 16.30 | |
| JNJ | 14.10 | |
| ABBV | 14.01 | |
| MRK | 3.01 | |
| ABT | 0.59 | |
| LLY | -4.46 | |
| AMGN | -5.88 | |
| ISRG | -13.60 |
Summary
✅ Over the analyzed periods, Thermo Fisher and UnitedHealth Group have demonstrated robust performance, marking them as potential candidates for investment consideration. 📉 However, the setbacks experienced by companies like Intuitive Surgical suggest caution in strategic positioning. 💡 Investors should remain vigilant and adaptable to macroeconomic shifts and sector-specific developments, carrying a diversified perspective to optimize their portfolio resilience.
Smart Data Insight
Master the Perfect Entry & Exit for this Stock
Don't leave your profits to chance. Historically, this stock follows specific seasonal patterns that institutional traders use to maximize returns.
- ✅ Identify the "Golden Buying Window"
- ✅ Avoid high-risk correction cycles
- ✅ Backtested data from the last 20+ years