
July 12, 2026 a 09:31 am


Healthcare Stocks - Performance Analysis
📊 The performance of healthcare stocks has exhibited varied trends over different timeframes. This report offers an in-depth analysis of the largest players in the sector, focusing on their short-term and medium-term stock performance. We highlight top performers and laggards, providing actionable insights for investors.
Healthcare Stocks Performance One Week
🔍 Over the past week, the healthcare sector showed mixed performances, with TMO leading the way with a positive gain. Conversely, ABBV and MRK underperformed significantly, indicating challenges within certain subsectors.
| Stock | Performance (%) | Performance |
|---|---|---|
| TMO | 0.74% | |
| UNH | -0.10% | |
| ABT | -1.55% | |
| LLY | -2.02% | |
| JNJ | -2.25% | |
| AMGN | -2.89% | |
| ISRG | -4.56% | |
| MRK | -4.69% | |
| ABBV | -5.06% |
Healthcare Stocks Performance One Month
📈 Over the past month, TMO registered robust growth, emerging as the sector's leader. ABBV also demonstrated significant gains, reinforcing the positive momentum in the healthcare industry.
| Stock | Performance (%) | Performance |
|---|---|---|
| TMO | 11.91% | |
| ABBV | 9.12% | |
| JNJ | 6.85% | |
| ABT | 6.58% | |
| LLY | 5.20% | |
| UNH | 4.11% | |
| MRK | 4.10% | |
| AMGN | 2.45% | |
| ISRG | -0.70% |
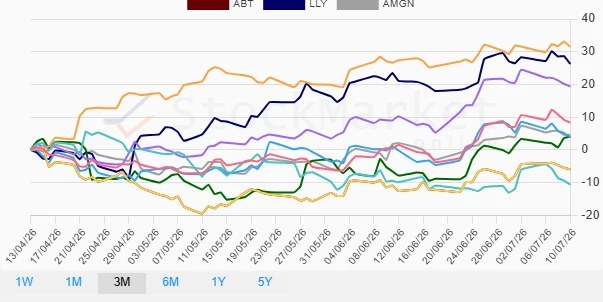
Healthcare Stocks Performance Three Months
⚡ Over the past three months, UNH took the lead with impressive gains, indicative of robust market confidence. On the flip side, ISRG encountered notable declines, possibly pointing to sector-specific challenges or competitive pressures.
| Stock | Performance (%) | Performance |
|---|---|---|
| UNH | 31.50% | |
| LLY | 26.31% | |
| ABBV | 19.42% | |
| JNJ | 8.38% | |
| AMGN | 4.53% | |
| TMO | 4.07% | |
| MRK | 3.92% | |
| ABT | -5.94% | |
| ISRG | -10.57% |
Summary
✅ In conclusion, the healthcare sector has presented diverse performance outcomes across different timeframes. While TMO and UNH have consistently outperformed in most periods, ISRG and ABT faced challenges over the three-month span. Investors should consider these dynamics when strategizing for future positions, taking into account both individual company performance and broader sectoral trends.
Smart Data Insight
Master the Perfect Entry & Exit for this Stock
Don't leave your profits to chance. Historically, this stock follows specific seasonal patterns that institutional traders use to maximize returns.
- ✅ Identify the "Golden Buying Window"
- ✅ Avoid high-risk correction cycles
- ✅ Backtested data from the last 20+ years