
February 08, 2026 a 09:31 am


Healthcare Stocks - Performance Analysis
The healthcare sector demonstrates remarkable diversity in its stock performance over the short, medium, and long term. This analysis aims to provide a detailed view of high-performing stocks and identify trends that may signal broader market movements. With top performers driving significant positive interest and underperformers raising concerns, it's vital to understand these dynamics in order to make informed investment decisions.
Healthcare Stocks Performance One Week
| Stock | Performance (%) | Performance |
|---|---|---|
| AMGN | 12.13 | |
| MRK | 10.16 | |
| JNJ | 5.50 | |
| LLY | 2.97 | |
| ABT | 1.40 | |
| ABBV | 0.29 | |
| ISRG | -3.13 | |
| UNH | -3.52 | |
| TMO | -6.26 |
Healthcare Stocks Performance One Month
| Stock | Performance (%) | Performance |
|---|---|---|
| AMGN | 17.00 | |
| JNJ | 16.20 | |
| MRK | 10.04 | |
| ABBV | 1.71 | |
| LLY | 0.69 | |
| TMO | -12.79 | |
| ABT | -12.11 | |
| ISRG | -18.05 | |
| UNH | -19.21 |
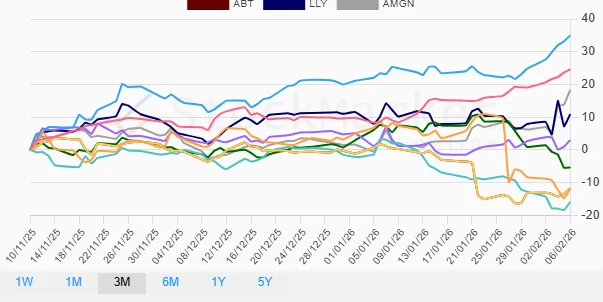
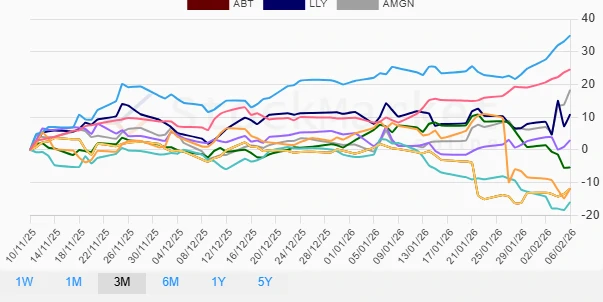
Healthcare Stocks Performance Three Months
| Stock | Performance (%) | Performance |
|---|---|---|
| MRK | 34.98 | |
| AMGN | 18.34 | |
| JNJ | 24.60 | |
| LLY | 10.89 | |
| ABBV | 2.99 | |
| TMO | -5.36 | |
| UNH | -11.84 | |
| ABT | -11.81 | |
| ISRG | -15.90 |
Summary
The healthcare sector's stock performance over the various time frames reveals key insights: AMGN and MRK stand out as consistent performers, especially in the one-week and three-month analyses. However, stocks like TMO and UNH demonstrate significant volatility with negative performances, particularly over the month-long timeframe. Investors might take advantage of the positive momentum in high-performing stocks like AMGN and MRK while closely monitoring underperforming stocks for potential rebound opportunities. Careful analysis of sector-specific drivers and macroeconomic conditions is recommended for optimal portfolio management.
Smart Data Insight
Master the Perfect Entry & Exit for this Stock
Don't leave your profits to chance. Historically, this stock follows specific seasonal patterns that institutional traders use to maximize returns.
- ✅ Identify the "Golden Buying Window"
- ✅ Avoid high-risk correction cycles
- ✅ Backtested data from the last 20+ years