October 05, 2025 a 09:31 am


📊 Healthcare Stocks - Performance Analysis
The recent performance of the largest healthcare stocks has provided us with valuable insights into market trends and investor sentiment. As we dive deep into weekly, monthly, and quarterly performances, key leaders and laggards emerge, painting a comprehensive picture of the sector’s dynamics. This analysis aims to evaluate how macroeconomic factors have influenced the healthcare sector, supported by detailed graphical representations.
🔍 Healthcare Stocks Performance One Week
| Stock | Performance (%) | Performance |
|---|---|---|
| TMO | 16.33 | |
| LLY | 15.24 | |
| MRK | 13.18 | |
| ABBV | 6.15 | |
| AMGN | 8.93 | |
| JNJ | 4.88 | |
| UNH | 4.61 | |
| ISRG | 2.58 | |
| ABT | 0.78 |
🔍 Healthcare Stocks Performance One Month
| Stock | Performance (%) | Performance |
|---|---|---|
| LLY | 15.02 | |
| UNH | 13.80 | |
| TMO | 10.58 | |
| ABBV | 10.00 | |
| MRK | 5.78 | |
| JNJ | 5.65 | |
| AMGN | 5.29 | |
| ABT | 1.35 | |
| ISRG | -2.91 |
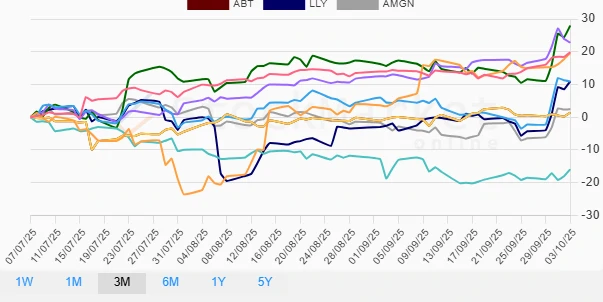
🔍 Healthcare Stocks Performance Three Months
| Stock | Performance (%) | Performance |
|---|---|---|
| TMO | 27.91 | |
| ABBV | 22.80 | |
| JNJ | 19.86 | |
| UNH | 19.55 | |
| LLY | 10.97 | |
| MRK | 10.92 | |
| AMGN | 2.48 | |
| ABT | 1.39 | |
| ISRG | -15.92 |
✅ Summary
The comprehensive data analysis reveals the leaders and laggards within the healthcare sector over different time frames. Thermo Fisher Scientific (TMO) emerged as the top performer across multiple periods, indicating strong market position and investor confidence. Conversely, Intuitive Surgical (ISRG) experienced a downturn, particularly noteworthy in the three-month analysis. Overall, the healthcare sector displayed robust growth, reflecting its defensive nature amid market uncertainties. Investors should consider these insights for strategic rebalancing and potential high-performing stocks identification.
Smart Data Insight
Master the Perfect Entry & Exit for this Stock
Don't leave your profits to chance. Historically, this stock follows specific seasonal patterns that institutional traders use to maximize returns.
- ✅ Identify the "Golden Buying Window"
- ✅ Avoid high-risk correction cycles
- ✅ Backtested data from the last 20+ years