October 01, 2025 a 04:45 pm
HWM: Fibonacci Analysis - Howmet Aerospace Inc.
Howmet Aerospace Inc. has shown resilience in its stock performance, catering to critical industries such as aerospace and transportation. A recent analysis shows a strong price movement, reflecting investor confidence. However, volatility in global markets and potential sector-specific challenges warrant cautious monitoring by stakeholders.
Fibonacci Analysis
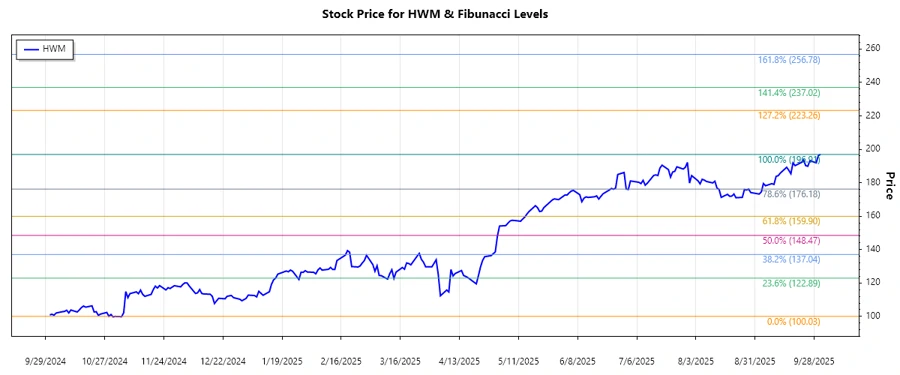
The analysis period identified a significant upward trend for Howmet Aerospace Inc., with the stock price reaching a high of $196.91 on 2025-10-01 from a low of $100.03 on 2024-11-01. The following Fibonacci retracement levels were calculated to identify potential support or resistance levels.
| Key Data | Value |
|---|---|
| Trend Start Date | 2024-11-01 |
| Trend End Date | 2025-10-01 |
| High Price | $196.91 (2025-10-01) |
| Low Price | $100.03 (2024-11-01) |
| Fibonacci Level | Price Level |
|---|---|
| 0.236 | $122.09 |
| 0.382 | $138.82 |
| 0.500 | $148.47 |
| 0.618 | $158.12 |
| 0.786 | $171.49 |
Currently, the stock is not within a retracement zone but is close to the 0.786 level. Should the price revisit this fib level, a potential support zone could form.
Technical interpretation suggests the existing upward momentum, underscored by strategic levels, could act as significant support or resistance, guiding future price movements.
Conclusion
Howmet Aerospace Inc.'s stock has displayed a compelling upward trend, buoyed by the demand in the aerospace and transportation sectors. Current technical readings hint at the potential for extended levels of support, although geopolitical shifts and raw material prices could introduce risks. For analysts, understanding these dynamics is essential for predicting future movements and making informed decisions. The stock's ability to hold above key Fibonacci levels also underscores investor confidence in the company's operational advantages. However, vigilance is required as market conditions evolve.
Smart Data Insight
Master the Perfect Entry & Exit for this Stock
Don't leave your profits to chance. Historically, this stock follows specific seasonal patterns that institutional traders use to maximize returns.
- ✅ Identify the "Golden Buying Window"
- ✅ Avoid high-risk correction cycles
- ✅ Backtested data from the last 20+ years