November 01, 2025 a 12:46 pm
HWM: Dividend Analysis - Howmet Aerospace Inc.
Howmet Aerospace Inc. demonstrates a distinguished dividend history with consistent growth over the past decade. Despite a brief cut in 2020, the company's dividends have rebounded, reflecting resilience and commitment to shareholder returns. Recent dividend growth suggests promising performance, making HWM an attractive investment for income-focused investors seeking stable returns.
📊 Overview
Howmet Aerospace Inc. operates within the aerospace sector, offering appealing growth and income opportunities through its dividend plans.
| Key Metrics | Details |
|---|---|
| Sector | Aerospace |
| Dividend Yield | 0.21% |
| Current Dividend Per Share | $0.27 |
| Dividend History | 10 years |
| Last Cut or Suspension | 2020 |
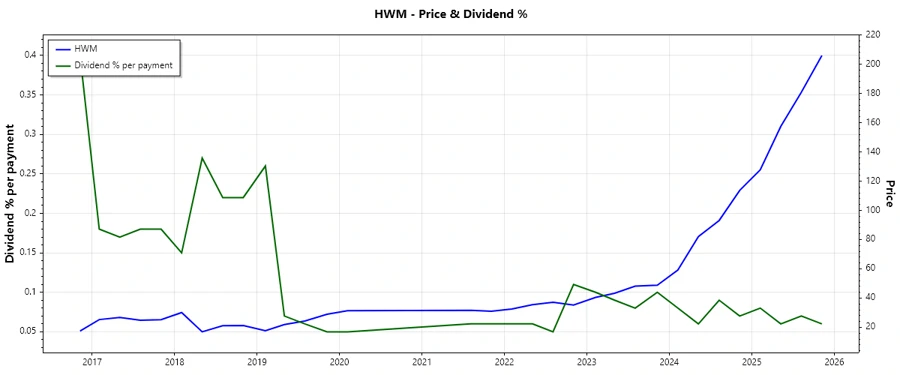
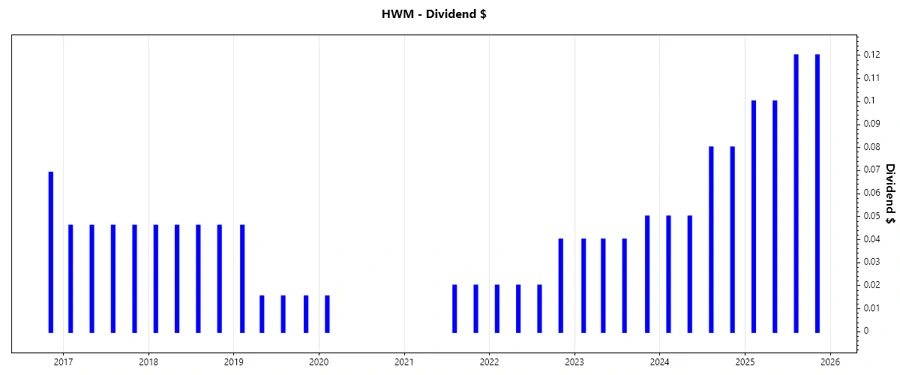
🗣️ Dividend History
The dividend history is indicative of the company's long-term commitment to returning capital to shareholders, a fundamental metric for evaluating financial stability.
| Year | Dividend Per Share (USD) |
|---|---|
| 2025 | 0.44 |
| 2024 | 0.26 |
| 2023 | 0.17 |
| 2022 | 0.10 |
| 2021 | 0.04 |
📈 Dividend Growth
The dividend growth rate reflects the company's ability to generate higher shareholder value over time, crucial for gauging sustainability and profitability.
| Time | Growth |
|---|---|
| 3 years | 0.87% |
| 5 years | 0.23% |
The average dividend growth is 0.23% over 5 years. This shows moderate but steady dividend growth.
✅ Payout Ratio
A lower payout ratio signals robust earnings retention for reinvestment and potential future dividend increases, benefiting shareholders.
| Key Figure | Ratio |
|---|---|
| EPS-based | 7.43% |
| Free Cash Flow-based | 10.16% |
The low payout ratios of 7.43% (EPS) and 10.16% (FCF) indicate a secure dividend supported by strong earnings and cash flow.
💰 Cashflow & Capital Efficiency
Cashflow metrics expose the company's operational efficiency and spending priorities, vital for long-term investment planning.
| Year | 2025 | 2024 | 2023 |
|---|---|---|---|
| Free Cash Flow Yield | 1.28% | 2.19% | 3.06% |
| Earnings Yield | 1.75% | 2.59% | 3.43% |
| CAPEX to Operating Cash Flow | 0.38 | 0.25 | 0.24 |
| Stock-based Compensation to Revenue | 0.85% | 0.85% | 0.75% |
| Free Cash Flow / Operating Cash Flow Ratio | 0.75 | 0.75 | 0.76 |
Strong cashflow ratios underscore Howmet Aerospace's stability in managing expenses and generating returns, enhancing capital efficiency.
⚖️ Balance Sheet & Leverage Analysis
Balance sheet strength provides insights into leverage and liquidity profiles, critical for assessing financial resilience.
| Year | 2024 | 2023 | 2022 |
|---|---|---|---|
| Debt-to-Equity | 0.76 | 0.95 | 1.19 |
| Debt-to-Assets | 0.33 | 0.37 | 0.42 |
| Debt-to-Capital | 0.43 | 0.49 | 0.54 |
| Net Debt to EBITDA | 1.13 | 2.20 | 3.17 |
| Current Ratio | 2.35 | 1.86 | 2.12 |
| Quick Ratio | 0.98 | 0.87 | 1.04 |
| Financial Leverage | 2.31 | 2.58 | 2.85 |
Howmet's improving leverage ratios signify prudent financial management, focusing on reducing debt relative to equity and total assets.
🛠️ Fundamental Strength & Profitability
Evaluating profitability ratios provides insight into operational success and investment attractiveness based on efficient utilization of resources.
| Year | 2024 | 2023 | 2022 |
|---|---|---|---|
| Return on Equity | 25.36% | 18.95% | 13.02% |
| Return on Assets | 10.98% | 7.34% | 4.57% |
| Margins: Net | 15.55% | 11.52% | 8.28% |
| Margins: EBIT | 21.06% | 17.97% | 14.74% |
| Margins: EBITDA | 24.79% | 22.06% | 19.42% |
| Research & Development to Revenue | 0.43% | 0.54% | 0.57% |
Strong profitability metrics reflect Howmet’s effective resource management, translating into substantial returns and ensuring long-term growth potential.
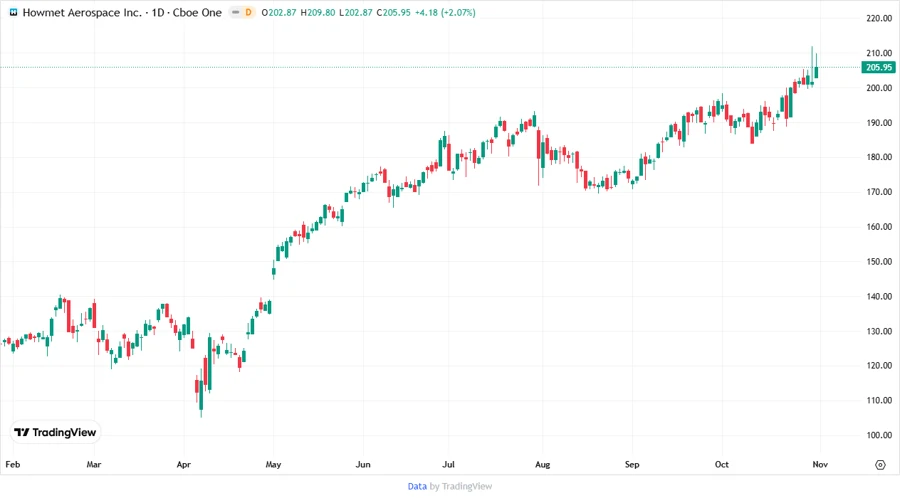
📈 Price Development
🔍 Dividend Scoring System
| Criteria | Description | Score |
|---|---|---|
| Dividend Yield | Measures revenue generated | |
| Dividend Stability | Evaluates consistency over years | |
| Dividend Growth | Indicates future potential | |
| Payout Ratio | Percentage of earnings distributed | |
| Financial Stability | Long-term viability measure | |
| Dividend Continuity | Uninterrupted payout history | |
| Cashflow Coverage | Ability to cover its obligations | |
| Balance Sheet Quality | Asset-Liability health |
Overall Score: 32/40
🏆 Rating
Howmet Aerospace Inc. presents itself as a robust investment opportunity within the aerospace industry. Demonstrating consistent dividend growth and financial stability, the company is well-positioned to provide shareholders with reliable returns. Consideration of the company's steadfast payout history and low payout ratio further solidifies its standing as a viable choice for dividend-seeking investors. With favorable financial health markers and disciplined management, HWM is rated as a strong "Buy".
Smart Data Insight
Master the Perfect Entry & Exit for this Stock
Don't leave your profits to chance. Historically, this stock follows specific seasonal patterns that institutional traders use to maximize returns.
- ✅ Identify the "Golden Buying Window"
- ✅ Avoid high-risk correction cycles
- ✅ Backtested data from the last 20+ years