August 12, 2025 a 07:46 am


📊 HWM: Dividend Analysis - Howmet Aerospace Inc.
Howmet Aerospace Inc. presents a promising dividend profile characterized by steady dividend growth over several years. Despite a low dividend yield, the company’s consistent payment history and manageable payout ratios signal strong dividend health. The company's strategic financial management reflects its ability to sustain and potentially increase dividends in the future.
🗣️ Overview
Howmet Aerospace Inc., operating in the Aerospace & Defense sector, offers a modest dividend yield of 0.22% with a current dividend per share of $0.27. The firm maintains a commendable dividend history, boasting 10 consecutive years of payments, with the last dividend cut occurring in 2020.
| Key Metrics | Details |
|---|---|
| Sector | Aerospace & Defense |
| Dividend Yield | 0.22% |
| Current Dividend per Share | 0.27 USD |
| Dividend History | 10 years |
| Last Cut or Suspension | 2020 |
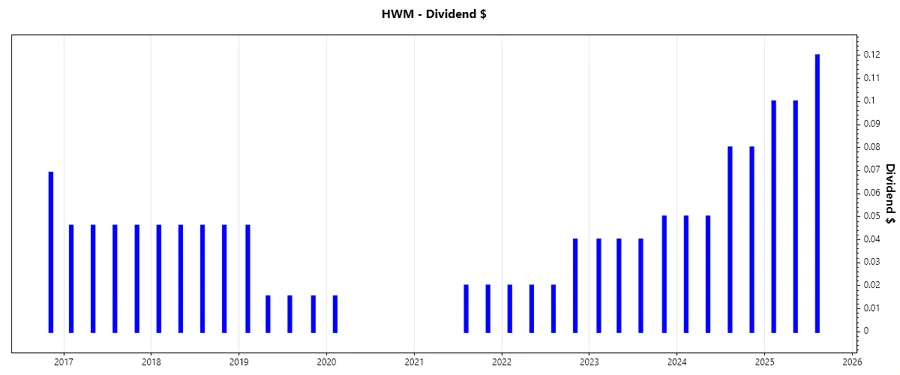
📈 Dividend History
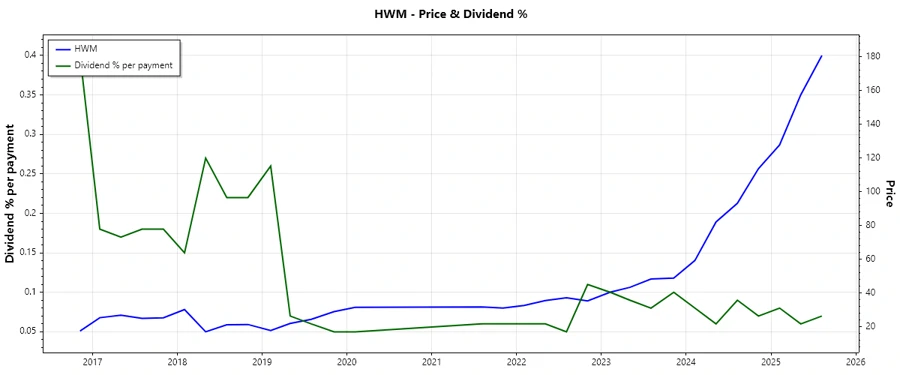
Understanding dividend history is crucial, as it provides insights into a company's commitment and ability to return value to its shareholders. Howmet shows a consistent record of dividend payments, an encouraging indicator for dividend stability.
| Year | Dividend per Share (USD) |
|---|---|
| 2025 | 0.32 |
| 2024 | 0.26 |
| 2023 | 0.17 |
| 2022 | 0.10 |
| 2021 | 0.04 |
✅ Dividend Growth
Dividend growth history is a vital indicator of a company’s financial health and strategic dividend policy. Howmet’s dividends grew by 0.87% over the past three years and 0.23% over five years, indicating sustainable growth.
| Time | Growth |
|---|---|
| 3 years | 0.87% |
| 5 years | 0.23% |
The average dividend growth is 0.23% over 5 years. This shows moderate but steady dividend growth.
⚠️ Payout Ratio
Payout ratios help assess a company's ability to maintain dividend payments. Howmet’s payout ratios, based on EPS and Free Cash Flow, stand at 7.73% and 10.58% respectively, reflecting a conservative and sustainable dividend policy.
| Key Figure | Ratio |
|---|---|
| EPS-based | 7.73% |
| Free Cash Flow-based | 10.58% |
With low payout ratios, the company’s dividends are well-protected, ensuring sustainability and potential future increases.
💡 Cashflow & Capital Efficiency
Cash flow and capital efficiency are essential for maintaining robust dividend payments and supporting company growth initiatives. Below is an analysis based on recent data.
| Metric | 2024 | 2023 | 2022 |
|---|---|---|---|
| Free Cash Flow Yield | 2.19% | 3.06% | 3.29% |
| Earnings Yield | 2.59% | 3.43% | 2.86% |
| CAPEX to Operating Cash Flow | 24.73% | 24.31% | 26.33% |
| Stock-based Compensation to Revenue | 0.85% | 0.75% | 0.95% |
| Free Cash Flow / Operating Cash Flow Ratio | 75.27% | 75.69% | 73.67% |
The cash flow metrics suggest a strong capacity to maintain operations and reward shareholders, with efficient capital usage bolstering returns.
🔍 Balance Sheet & Leverage Analysis
Assessing financial leverage and balance sheet strength is critical for evaluating the long-term viability of dividend policies.
| Ratio | 2024 | 2023 | 2022 |
|---|---|---|---|
| Debt-to-Equity | 0.76 | 0.95 | 1.16 |
| Debt-to-Assets | 0.33 | 0.37 | 0.41 |
| Debt-to-Capital | 0.43 | 0.49 | 0.54 |
| Net Debt to EBITDA | 1.58 | 2.20 | 2.68 |
| Current Ratio | 2.31 | 1.86 | 2.12 |
| Quick Ratio | 0.98 | 0.87 | 1.04 |
| Financial Leverage | 2.31 | 2.58 | 2.85 |
Howmet maintains a balanced capital structure with manageable leverage, supporting financial stability and dividend safety.
🔎 Fundamental Strength & Profitability
Evaluating profitability and fundamental strength is essential for determining a company’s potential to sustain and grow dividends.
| Metric | 2024 | 2023 | 2022 |
|---|---|---|---|
| Return on Equity | 25.36% | 18.95% | 13.02% |
| Return on Assets | 10.98% | 7.34% | 4.57% |
| Margins: Net | 15.55% | 11.52% | 8.28% |
| EBIT Margin | 21.06% | 17.97% | 17.57% |
| EBITDA Margin | 24.79% | 22.06% | 22.25% |
| Gross Margin | 31.10% | 28.12% | 27.55% |
| Research & Development to Revenue | 0.44% | 0.54% | 0.57% |
Strong profitability measures and robust fundamental indicators underpin Howmet’s ability to provide consistent shareholder returns.
📉 Price Development
📊 Dividend Scoring System
| Criteria | Score (1-5) | Rating |
|---|---|---|
| Dividend Yield | 2 | |
| Dividend Stability | 4 | |
| Dividend Growth | 3 | |
| Payout Ratio | 5 | |
| Financial Stability | 4 | |
| Dividend Continuity | 5 | |
| Cashflow Coverage | 4 | |
| Balance Sheet Quality | 3 |
Total Score: 30/40
📈 Rating
Based on the evaluation, Howmet Aerospace Inc. demonstrates strong financial health and a robust dividend profile, making it a reliable choice for investors seeking moderate dividend growth with safety. Given the current market dynamics and company fundamentals, it is recommended as a "Buy" for risk-averse dividend investors.
Smart Data Insight
Master the Perfect Entry & Exit for this Stock
Don't leave your profits to chance. Historically, this stock follows specific seasonal patterns that institutional traders use to maximize returns.
- ✅ Identify the "Golden Buying Window"
- ✅ Avoid high-risk correction cycles
- ✅ Backtested data from the last 20+ years