July 22, 2025 a 11:31 am


HWM: Dividend Analysis - Howmet Aerospace Inc.
Howmet Aerospace Inc. presents a robust dividend profile with consistent dividend payment history. Despite a modest yield, their strategy focuses on sustainable and moderate growth, crucial for long-term investors. The company's commitment to dividend continuity even through economic downturns is a commendable aspect of its financial operations.
📊 Overview
Howmet Aerospace Inc., operating within a dynamic sector, maintains a disciplined approach to shareholder returns.
| Metric | Details |
|---|---|
| Sector | Aerospace |
| Dividend yield | 0.23% |
| Current dividend per share | 0.27 USD |
| Dividend history | 10 years |
| Last cut or suspension | None |
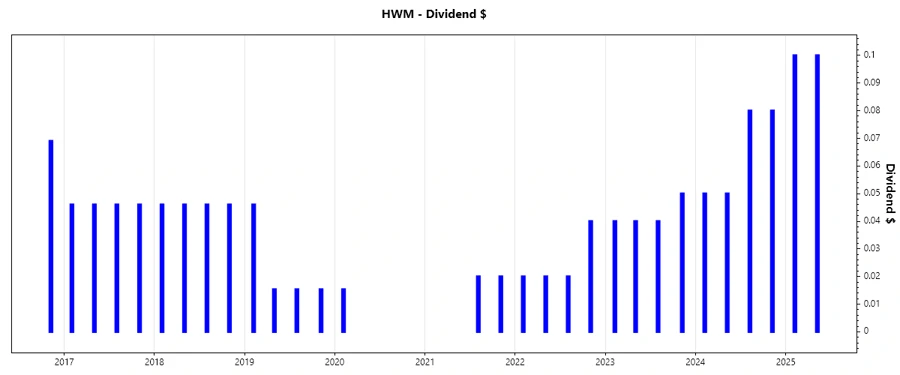
📈 Dividend History
Consistency in dividend payouts is pivotal for investors seeking steady income. HWM's sustained dividend payout over the years highlights its stability.
| Year | Dividend Per Share (USD) |
|---|---|
| 2025 | 0.20 |
| 2024 | 0.26 |
| 2023 | 0.17 |
| 2022 | 0.10 |
| 2021 | 0.04 |
📊 Dividend Growth
Dividend growth is a critical factor that signals the company's ability to increase shareholder returns over time. HWM demonstrates notable growth over the observed periods.
| Time | Growth |
|---|---|
| 3 years | 0.87% |
| 5 years | 0.23% |
The average dividend growth is 0.23% over 5 years. This shows moderate but steady dividend growth.
💰 Payout Ratio
Payout ratios indicate the portion of earnings paid out as dividends. Lower ratios suggest potential room for dividend increases.
| Key figure ratio | Value |
|---|---|
| EPS-based | 8.61% |
| Free cash flow-based | 10.61% |
Both EPS and FCF payout ratios reflect a conservative approach, emphasizing financial prudence, which supports dividend stability.
🔍 Cashflow & Capital Efficiency
The analysis of cash flow-related metrics reflects the company’s ability to generate free cash flow and efficiently allocate capital.
| 2024 | 2023 | 2022 | |
|---|---|---|---|
| Free Cash Flow Yield | 2.19% | 3.06% | 3.29% |
| Earnings Yield | 2.59% | 3.43% | 2.86% |
| CAPEX to Operating Cash Flow | 24.73% | 24.31% | 26.33% |
| Stock-based Compensation to Revenue | 0.85% | 0.75% | 0.95% |
| Free Cash Flow / Operating Cash Flow Ratio | 75.27% | 75.69% | 73.67% |
The company’s stable free cash flow supports its dividend policy and potential for future growth, while maintaining healthy capital allocation.
🗣️ Balance Sheet & Leverage Analysis
Effective leverage and financial ratios highlight the company’s operational prudence and long-term financial health.
| 2024 | 2023 | 2022 | |
|---|---|---|---|
| Debt-to-Equity | 76.22% | 94.99% | 115.58% |
| Debt-to-Assets | 32.99% | 36.78% | 40.59% |
| Debt-to-Capital | 43.25% | 48.72% | 53.61% |
| Net Debt to EBITDA | 1.58 | 2.20 | 2.68 |
| Current Ratio | 2.17 | 1.86 | 2.12 |
| Quick Ratio | 0.98 | 0.87 | 1.04 |
| Financial Leverage | 2.31 | 2.58 | 2.85 |
HWM's prudent leverage management and healthy liquidity ratios underpin its financial stability and resilience against macroeconomic headwinds.
📈 Fundamental Strength & Profitability
These fundamentals reflect the company's operational efficiency and ability to generate profit margins.
| 2024 | 2023 | 2022 | |
|---|---|---|---|
| Return on Equity | 25.36% | 18.95% | 13.02% |
| Return on Assets | 10.98% | 7.34% | 4.57% |
| Net Margin | 15.55% | 11.52% | 8.28% |
| EBIT Margin | 21.06% | 17.97% | 17.57% |
| EBITDA Margin | 24.79% | 22.06% | 22.25% |
| Gross Margin | 31.10% | 28.12% | 27.55% |
| Research & Development to Revenue | 0.44% | 0.54% | 0.57% |
The company's impressive margins and strong returns showcase its competitive advantage and ability to generate strong earnings.
⚠️ Price Development
✅ Dividend Scoring System
| Criteria | Score | Representation |
|---|---|---|
| Dividend yield | 2 | |
| Dividend Stability | 4 | |
| Dividend growth | 3 | |
| Payout ratio | 5 | |
| Financial stability | 4 | |
| Dividend continuity | 5 | |
| Cashflow Coverage | 3 | |
| Balance Sheet Quality | 4 |
Total Score: 30/40
🗣️ Rating
Howmet Aerospace Inc. is a compelling investment with its commitment to dividend consistency and financial health. While the dividend yield may be modest, its stability and growth potential render it a solid choice for long-term dividend-focused investors.
Smart Data Insight
Master the Perfect Entry & Exit for this Stock
Don't leave your profits to chance. Historically, this stock follows specific seasonal patterns that institutional traders use to maximize returns.
- ✅ Identify the "Golden Buying Window"
- ✅ Avoid high-risk correction cycles
- ✅ Backtested data from the last 20+ years