July 11, 2025 a 12:47 pm
HWM: Dividend Analysis - Howmet Aerospace Inc.
Howmet Aerospace Inc. showcases a solid dividend profile, demonstrating resilience in maintaining payouts over the years. The company's ability to sustain a consistent dividend despite economic fluctuations underscores its robust financial position. Examining the growth trajectories and payout ratios further illuminates the long-term viability of its shareholder return strategies.
📊 Overview
Howmet Aerospace Inc. operates in a strategic market sector that supports a unique dividend proposition. The analysis of its dividend yield alongside historical payout consistency reveals its commitment to shareholder value.
| Aspect | Details |
|---|---|
| Sector | Aerospace |
| Dividend yield | 0.26% |
| Current dividend per share | 0.27 USD |
| Dividend history | 10 years |
| Last cut or suspension | None |
🗣️ Dividend History
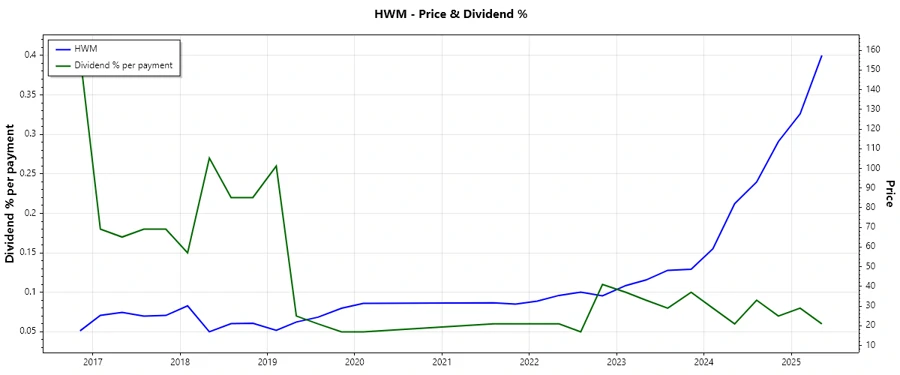
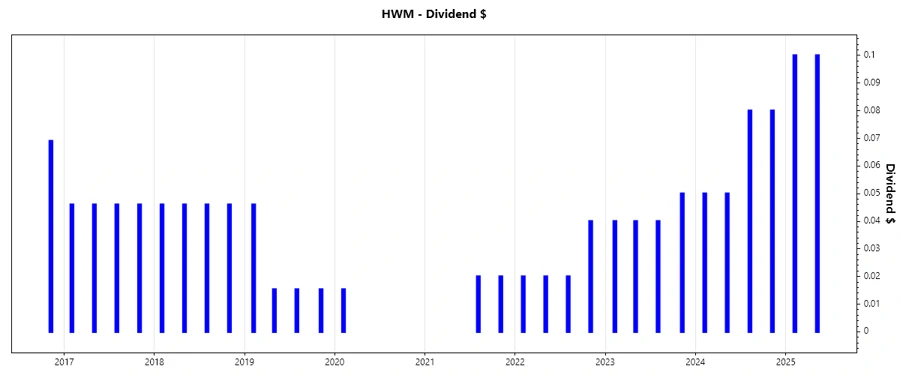
The dividend history of Howmet Aerospace Inc. reflects its strong commitment to returning cash to shareholders. Over the past decade, consistent payouts have been maintained with strategic adjustments enhancing shareholder trust. This historical stability is a testament to its adept financial management.
| Year | Dividend per Share (USD) |
|---|---|
| 2025 | 0.20 |
| 2024 | 0.26 |
| 2023 | 0.17 |
| 2022 | 0.10 |
| 2021 | 0.04 |
📈 Dividend Growth
Understanding dividend growth is crucial for investors seeking residual income. Howmet Aerospace Inc. has shown a 0.87% growth over 3 years and 0.23% over 5 years, signaling moderate yet stable progress. This growth underscores the company’s strategic adaptability and long-term financial planning.
| Time | Growth |
|---|---|
| 3 years | 0.87% |
| 5 years | 0.23% |
The average dividend growth is 0.23% over 5 years. This shows moderate but steady dividend growth.
✅ Payout Ratio
The payout ratio is a key gauge of dividend sustainability. Howmet Aerospace Inc.'s EPS-based payout ratio stands at 8.61%, and the FCF-based ratio at 10.61%. These figures suggest the company maintains dividends well within earnings and cash flow capacity.
| Key figure | Ratio |
|---|---|
| EPS-based | 8.61% |
| Free cash flow-based | 10.61% |
Given the low payout ratios, Howmet Aerospace Inc. presents a strong capacity for sustaining and potentially expanding dividends without compromising financial health.
💰 Cashflow & Capital Efficiency
Assessing the free cash flow yields, earnings yields, and capital expenditure ratios is essential for understanding efficiency in capital utilization. This analysis reflects the company's strategic deployment of resources that ensure sustainable growth and return prospects.
| Year | 2024 | 2023 | 2022 |
|---|---|---|---|
| Free Cash Flow Yield | 2.19% | 3.06% | 3.29% |
| Earnings Yield | 2.59% | 3.43% | 2.86% |
| CAPEX to Operating Cash Flow | 24.73% | 24.31% | 26.33% |
| Stock-based Compensation to Revenue | 0.85% | 0.75% | 0.95% |
| Free Cash Flow / Operating Cash Flow Ratio | 75.27% | 75.69% | 73.67% |
With consistent free cash flow yields and strong capital allocation ratios, Howmet Aerospace demonstrates effective use of resources, ensuring financial stability and potential growth.
📊 Balance Sheet & Leverage Analysis
A healthy balance sheet is crucial for sustaining operations and supporting dividend policies. The company's leverage ratios are meticulously managed, ensuring solvency and operational agility.
| Year | 2024 | 2023 | 2022 |
|---|---|---|---|
| Debt-to-Equity | 0.76 | 0.95 | 1.16 |
| Debt-to-Assets | 0.33 | 0.37 | 0.41 |
| Debt-to-Capital | 0.43 | 0.49 | 0.54 |
| Net Debt to EBITDA | 1.58 | 2.20 | 2.68 |
| Current Ratio | 2.17 | 1.86 | 2.12 |
| Quick Ratio | 0.98 | 0.87 | 1.04 |
| Financial Leverage | 2.31 | 2.58 | 2.85 |
Showing healthy leverage and liquidity ratios, Howmet Aerospace’s financial policies support long-term sustainability and capacity to absorb economic shocks.
📈 Fundamental Strength & Profitability
Profitability metrics like net margins and returns indicate the company's ability to generate adequate returns on investment, illustrating efficient management practices and market positioning.
| Year | 2024 | 2023 | 2022 |
|---|---|---|---|
| Return on Equity | 25.36% | 18.95% | 13.02% |
| Return on Assets | 11.00% | 7.34% | 4.57% |
| Margins: Net | 15.55% | 11.52% | 8.28% |
| EBIT | 21.06% | 17.97% | 17.57% |
| EBITDA | 24.79% | 22.06% | 22.25% |
| Gross | 31.10% | 28.12% | 27.55% |
| R&D to Revenue | 0.44% | 0.54% | 0.56% |
The metrics reflect Howmet Aerospace’s efficiency in generating profit relative to its revenue and equity, showcasing a robust business model adaptable to changing conditions.
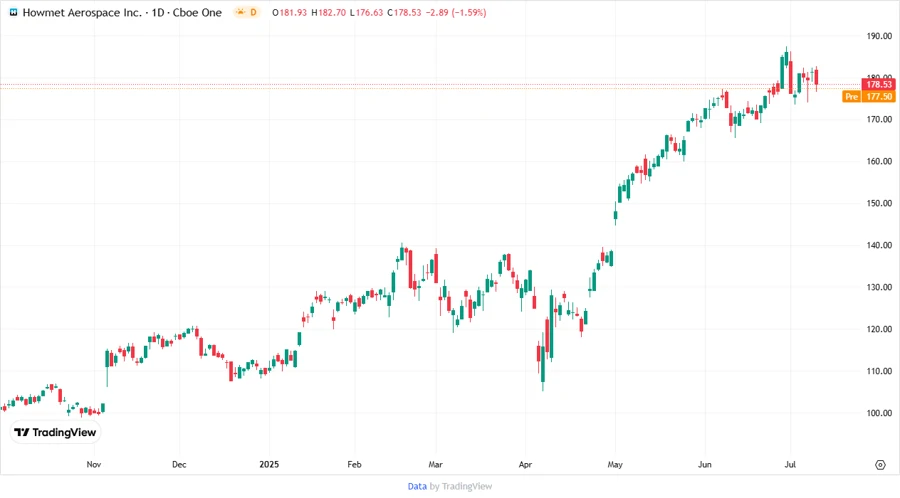
💹 Price Development
🎯 Dividend Scoring System
| Category | Score (1-5) | Visual Indicator |
|---|---|---|
| Dividend yield | 2 | |
| Dividend Stability | 4 | |
| Dividend growth | 3 | |
| Payout ratio | 5 | |
| Financial stability | 4 | |
| Dividend continuity | 5 | |
| Cashflow Coverage | 4 | |
| Balance Sheet Quality | 4 |
Overall Score: 31/40
🔍 Rating
In conclusion, Howmet Aerospace Inc. presents a solid dividend profile reinforced by stable financials and strategic market positioning, suggesting a favorable investment potential. The company offers a reliable stream of income, ideal for long-term dividend-focused investment strategies.
Smart Data Insight
Master the Perfect Entry & Exit for this Stock
Don't leave your profits to chance. Historically, this stock follows specific seasonal patterns that institutional traders use to maximize returns.
- ✅ Identify the "Golden Buying Window"
- ✅ Avoid high-risk correction cycles
- ✅ Backtested data from the last 20+ years