March 20, 2026 a 02:03 pm
HUBB: Trend and Support & Resistance Analysis - Hubbell Incorporated
Hubbell Incorporated has been showcasing a variety of stock movements. The company's stock trends are influenced by external market factors, innovation in electrical solutions, and partnerships that drive its product distribution. While both Electrical and Utility Solution segments offer a diversified revenue stream, investors should closely monitor the trends for better insight into future stock value. This analysis provides a detailed look at current trends and support and resistance zones.
Trend Analysis
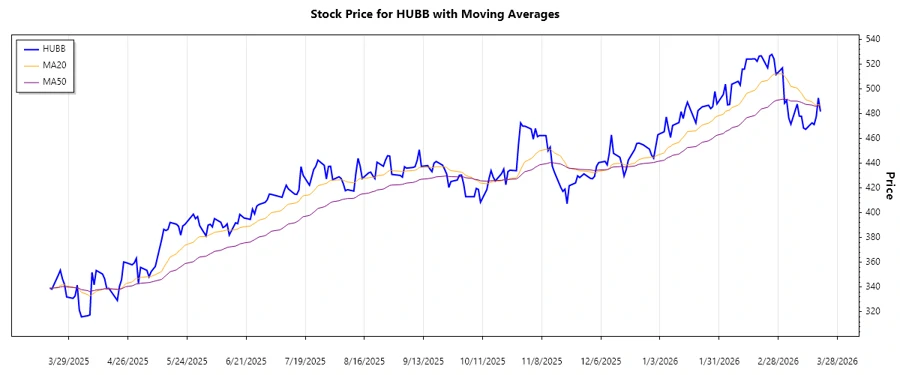
This section analyzes the historical price data to determine the prevailing trend for Hubbell Incorporated. Calculating the exponential moving averages (EMA) for 20 and 50 days allows us to identify the trend direction.
| Date | Close Price | Trend |
|---|---|---|
| 2026-03-20 | 481.74 | ▲ |
| 2026-03-19 | 492.65 | ▲ |
The analysis indicates a mixed trend with recent upward movements as EMA 20 surpasses EMA 50. Technically, this suggests a positive sentiment among traders, reflected in increasing buying interest.
Support and Resistance
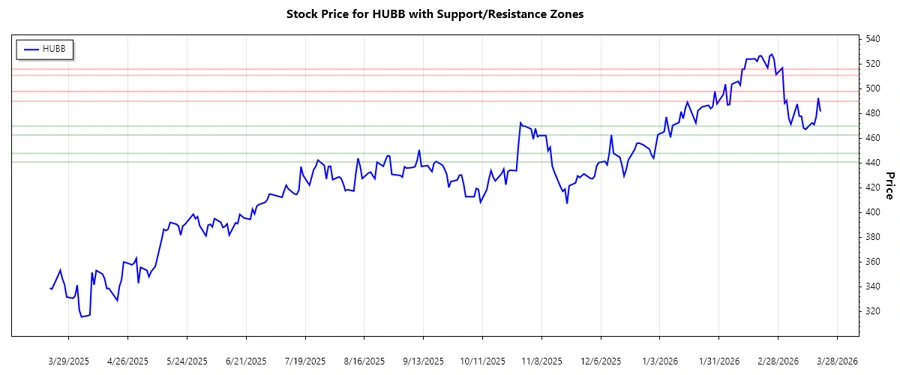
The following table provides the calculated support and resistance zones based on historical price data.
| Zone Type | Price Range |
|---|---|
| Support 1 | ▼ 462.82 - 470.00 |
| Support 2 | ▼ 441.00 - 448.00 |
| Resistance 1 | ▲ 490.00 - 498.00 |
| Resistance 2 | ▲ 511.00 - 516.00 |
Currently, the stock price is near the resistance zone, indicating potential selling pressure if unable to break through the current levels. Traders should look for confirmation to ascertain full trend strength.
Conclusion
Overall, Hubbell Incorporated's stock exhibits a positive trend, yet faces significant levels of resistance. While the medium-term trend appears bullish, reflected by EMA 20 surpassing EMA 50, the resistance levels may hinder a swift upward movement. Investors must weigh their strategies, considering both the company's growth potential and the challenges of penetrating existing resistance levels. The stock's position near the resistance suggests monitoring for a decisive breakout for potential investments.