November 22, 2025 a 08:15 am
HUBB: Trend and Support & Resistance Analysis - Hubbell Incorporated
Hubbell Incorporated operates in a diverse market, providing electrical and electronic products across the globe. The stock recently showed volatility but is currently stabilizing. Investors might find opportunities based on current trend and support/resistance zones. However, market dynamics such as competition and economic changes should be considered.
Trend Analysis
| Date | Close Price | Trend |
|---|---|---|
| 2025-11-21 | 421.84 | ▼ |
| 2025-11-20 | 407.36 | ▼ |
| 2025-11-19 | 419.09 | ▼ |
| 2025-11-18 | 417.28 | ▼ |
| 2025-11-17 | 420.57 | ▼ |
| 2025-11-14 | 432.82 | ▼ |
| 2025-11-13 | 437.65 | ▼ |
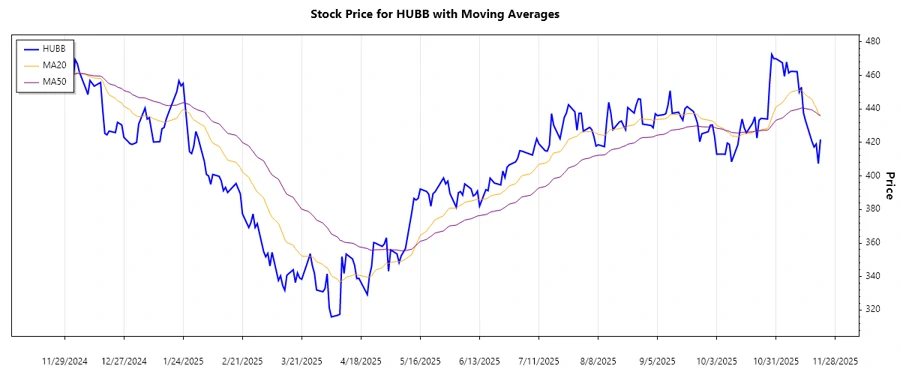
The recent trend indicates a bearish movement as the EMA20 is below EMA50. This suggests a potential continued downturn unless a reversal pattern emerges.
Support and Resistance
| Zone Type | From | To |
|---|---|---|
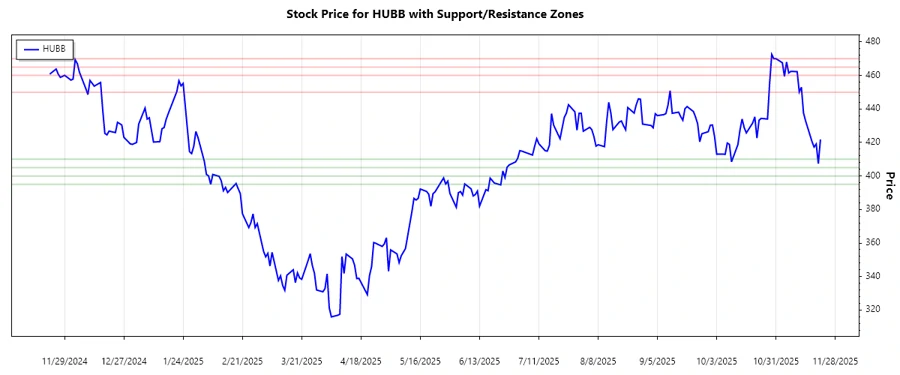
| Support | 405.00 | 410.00 |
| Support | 395.00 | 400.00 |
| Resistance | 450.00 | 460.00 |
| Resistance | 465.00 | 470.00 |
Currently, the stock is close to the support zone of 405-410, indicating potential stabilization. A bounce off this zone could lead to a rally towards resistance.
Conclusion
Hubbell Incorporated’s stock exhibits a recent downward trend, reinforced by a bearish EMA crossover. While nearing a support zone could signal a temporary bottom, investors should proceed cautiously. Consistent monitoring of support and resistance levels, coupled with external market factors, will be crucial. This analysis highlights the stock's volatility and potential for fluctuating trading conditions.
Smart Data Insight
Master the Perfect Entry & Exit for this Stock
Don't leave your profits to chance. Historically, this stock follows specific seasonal patterns that institutional traders use to maximize returns.
- ✅ Identify the "Golden Buying Window"
- ✅ Avoid high-risk correction cycles
- ✅ Backtested data from the last 20+ years