October 27, 2025 a 03:15 am
HUBB: Trend and Support & Resistance Analysis - Hubbell Incorporated
The stock of Hubbell Incorporated (HUBB) has exhibited a stable performance over the past months, showcasing both growth potential and resilience in the face of market fluctuations. With a diverse product range and global reach, the company continues to maintain a strong position in the electrical and electronic products market. Investors may find potential opportunities considering both short-term movements and long-term outlook based on identified technical patterns.
Trend Analysis
| Date | Close Price | Trend |
|---|---|---|
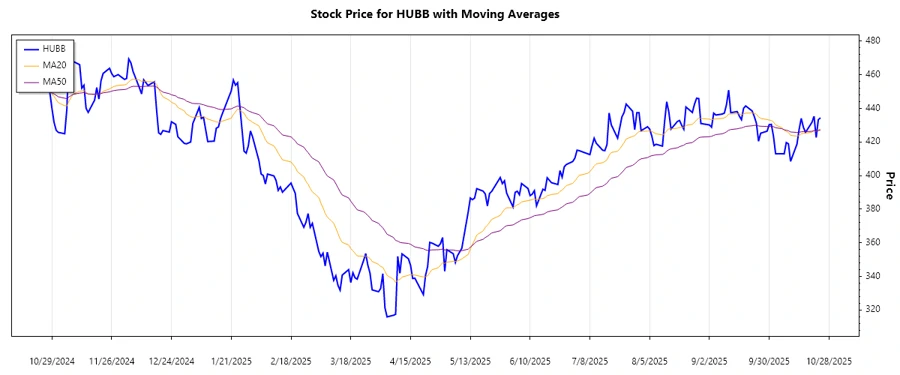
| 2025-10-24 | 434.39 | ▲ Uptrend |
| 2025-10-23 | 433.27 | ▼ Downtrend |
| 2025-10-22 | 422.63 | ▼ Downtrend |
| 2025-10-21 | 435.29 | ▲ Uptrend |
| 2025-10-20 | 431.65 | ▲ Uptrend |
| 2025-10-17 | 425.71 | ▼ Downtrend |
| 2025-10-16 | 428.82 | ▲ Uptrend |
The EMA20 is surpassing the EMA50, indicating a predominant upward trend, indicating potential further elevation in stock prices.
Support- and Resistance
| Zone Type | Price Range |
|---|---|
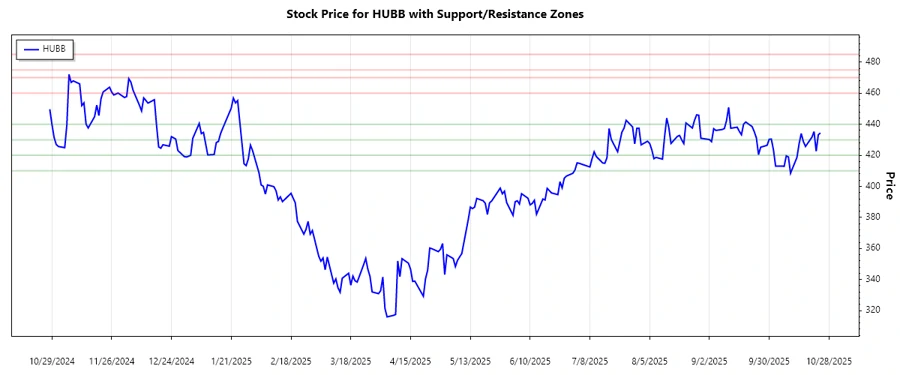
| Support Zone 1 | 410.00 - 420.00 |
| Support Zone 2 | 430.00 - 440.00 |
| Resistance Zone 1 | 460.00 - 470.00 |
| Resistance Zone 2 | 475.00 - 485.00 |
The current price of 434.39 lies within the second support zone, which might offer a solid foundation for any potential upward trend reversal.
Conclusion
Hubbell Incorporated presents a robust opportunity for investment with the recent technical analysis indicating an uptrend. The stock price is currently situated in a support zone, suggesting potential for growth upon market advancement. However, noticeable resistance levels could pose challenges if the price increases, necessitating careful monitoring. Overall, Hubbell’s stable market position and versatile product offerings continue to serve as advantageous attributes for long-term growth possibilities.
Smart Data Insight
Master the Perfect Entry & Exit for this Stock
Don't leave your profits to chance. Historically, this stock follows specific seasonal patterns that institutional traders use to maximize returns.
- ✅ Identify the "Golden Buying Window"
- ✅ Avoid high-risk correction cycles
- ✅ Backtested data from the last 20+ years