August 07, 2025 a 04:03 am


HUBB: Trend and Support & Resistance Analysis - Hubbell Incorporated
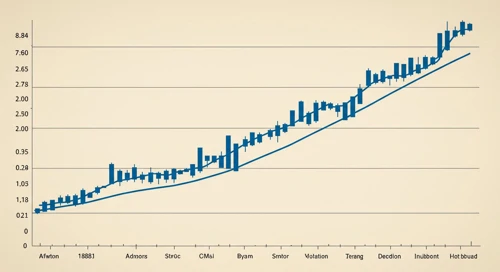
Hubbell Incorporated has shown significant momentum in its recent price trend, indicating a recovery from previous lows. The overall sentiment appears bullish as the company maintains its strong market presence through diverse segments. Investors may find HUBB's stock appealing based on its financial health and robust product offerings. However, external economic conditions and industry-specific challenges still pose risks.
Trend Analysis
| Date | Close Price | Trend |
|---|---|---|
| 2025-08-06 | $423.57 | ▲ Onward |
| 2025-08-05 | $427.67 | ▲ Upward |
| 2025-08-04 | $429.06 | ▲ Upward |
| 2025-08-01 | $426.74 | ▲ Upward |
| 2025-07-31 | $437.48 | ▲ Upward |
| 2025-07-30 | $437.44 | ▲ Upward |
| 2025-07-29 | $427.33 | ▲ Upward |
The EMA20 is above the EMA50, suggesting a strong upward trend. This positive momentum could indicate a good buying opportunity.
Support and Resistance
| Level | From | To |
|---|---|---|
| Support Zone 1 | $408 | $415 |
| Support Zone 2 | $390 | $400 |
| Resistance Zone 1 | $440 | $450 |
| Resistance Zone 2 | $455 | $465 |
The current price is approaching the first resistance zone, indicating a potential pullback unless it breaks through.
Conclusion
Hubbell Incorporated's stock is currently in a strong uptrend, suggesting favorable conditions for investors. Market factors and the company's industry positioning support this momentum. However, approaching resistance zones may pose challenges, requiring mindful strategy and observation. Analysts should weigh the prevailing economic backdrop against HUBB's historical resilience and focus on risk mitigation. Overall, HUBB remains an attractive proposition for growth-oriented investors, although caution should be exercised at resistance points.
Smart Data Insight
Master the Perfect Entry & Exit for this Stock
Don't leave your profits to chance. Historically, this stock follows specific seasonal patterns that institutional traders use to maximize returns.
- ✅ Identify the "Golden Buying Window"
- ✅ Avoid high-risk correction cycles
- ✅ Backtested data from the last 20+ years