
June 11, 2026 a 07:43 am
HUBB: Fundamental Ratio Analysis - Hubbell Incorporated
Hubbell Incorporated, a prominent player in the electrical and electronic merchandise industry, showcases a balanced growth trajectory. With its dual-focused business model, the company continues to maintain robust market positions across various sectors. The stock presents a stable outlook with moderate potential for growth, driven by its strong brand portfolio and strategic market presence.
Fundamental Rating
The following ratings encapsulate Hubbell's financial health and market valuation, reflecting its business solidity.
| Category | Score | Visual Representation |
|---|---|---|
| Discounted Cash Flow | 4 | |
| Return on Equity | 5 | |
| Return on Assets | 5 | |
| Debt to Equity | 2 | |
| Price to Earnings | 2 | |
| Price to Book | 1 |
Historical Rating
An overview of Hubbell’s previous and current ratings helps gauge the company’s financial momentum.
| Date | Overall Score | DCF | ROE | ROA | D/E | P/E | P/B |
|---|---|---|---|---|---|---|---|
| 2026-06-11 | 3 | 4 | 5 | 5 | 2 | 2 | 1 |
| 2026-06-10 | 3 | 4 | 5 | 5 | 2 | 2 | 1 |
Analyst Price Targets
Analysts' forecasts provide a consensus outlook on the expected price trajectory for Hubbell’s stock.
| High | Low | Median | Consensus |
|---|---|---|---|
| $600 | $450 | $565 | $545.43 |
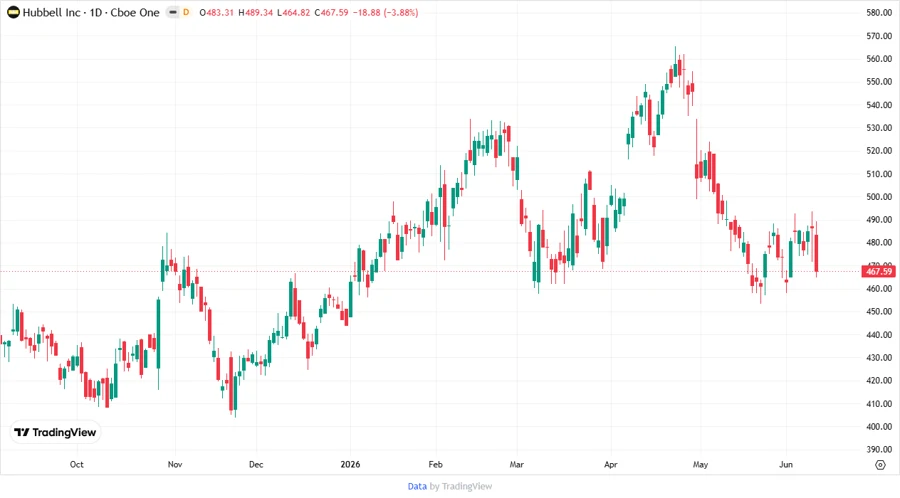
Responsive depiction of recent stock price trends and analyst expectations.
Analyst Sentiment
The table below summarizes analysts' sentiment regarding Hubbell’s stock, highlighting their recommendations.
| Recommendation | Count | Distribution |
|---|---|---|
| Strong Buy | 0 | |
| Buy | 7 | |
| Hold | 9 | |
| Sell | 1 | |
| Strong Sell | 0 |
Conclusion
Hubbell Incorporated presents a stable investment opportunity, with a balanced financial profile and subdued market risks. The fundamental ratings suggest moderate financial strength, backed by substantial assets and equity returns. Despite conservative price targets, its diversified portfolio positions the company strong across multiple sectors. Investors should weigh the potential for steady growth against industry and economic fluctuations. Overall, Hubbell remains a solid, if not exceptionally dynamic, stock choice.
Smart Data Insight
Master the Perfect Entry & Exit for this Stock
Don't leave your profits to chance. Historically, this stock follows specific seasonal patterns that institutional traders use to maximize returns.
- ✅ Identify the "Golden Buying Window"
- ✅ Avoid high-risk correction cycles
- ✅ Backtested data from the last 20+ years