March 04, 2026 a 03:15 pm

HUBB: Fibonacci Analysis - Hubbell Incorporated
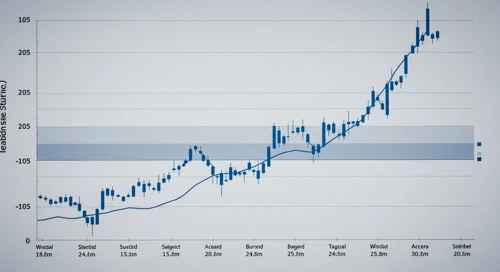
Hubbell Incorporated has demonstrated strong upward momentum, suggesting an optimistic investor outlook. The stock has experienced a significant price increase over the past few months, likely influenced by positive company developments and broader market trends. The engineering and utilities domains that Hubbell operates within have shown resilience, which has favored its stock position. This analysis will utilize Fibonacci retracement levels to gauge potential future price corrections and identify key support and resistance levels.
Fibonacci Analysis
| Details | Information |
|---|---|
| Start Date of Trend | 2025-05-08 |
| End Date of Trend | 2026-02-25 |
| High Point Price & Date | $527.90 on 2026-02-25 |
| Low Point Price & Date | $354.57 on 2025-05-08 |
Fibonacci Levels
| Level | Price |
|---|---|
| 0.236 | $482.08 |
| 0.382 | $459.84 |
| 0.5 | $441.24 |
| 0.618 | $422.64 |
| 0.786 | $392.48 |
Currently, the stock price is trading around the 0.236 retracement level, indicating that it has undergone a slight pullback within the overall uptrend. If sustained, this zone could act as a noteworthy support level, providing a base for a renewed upward movement. Conversely, a drop below this level may suggest further retracement to deeper Fibonacci levels.
Conclusion
The upward trend in Hubbell's stock, based on strong sector performance and company fundamentals, represents positive momentum. However, the recent retracement warrants a cautious outlook, monitoring key Fibonacci levels for potential support or deeper corrections. Sustained support at these levels may attract bullish interest, while further decline could challenge investor confidence. Analysts should consider sector trends and company announcements for potential impacts, weighing the growth potential against market volatility risks.